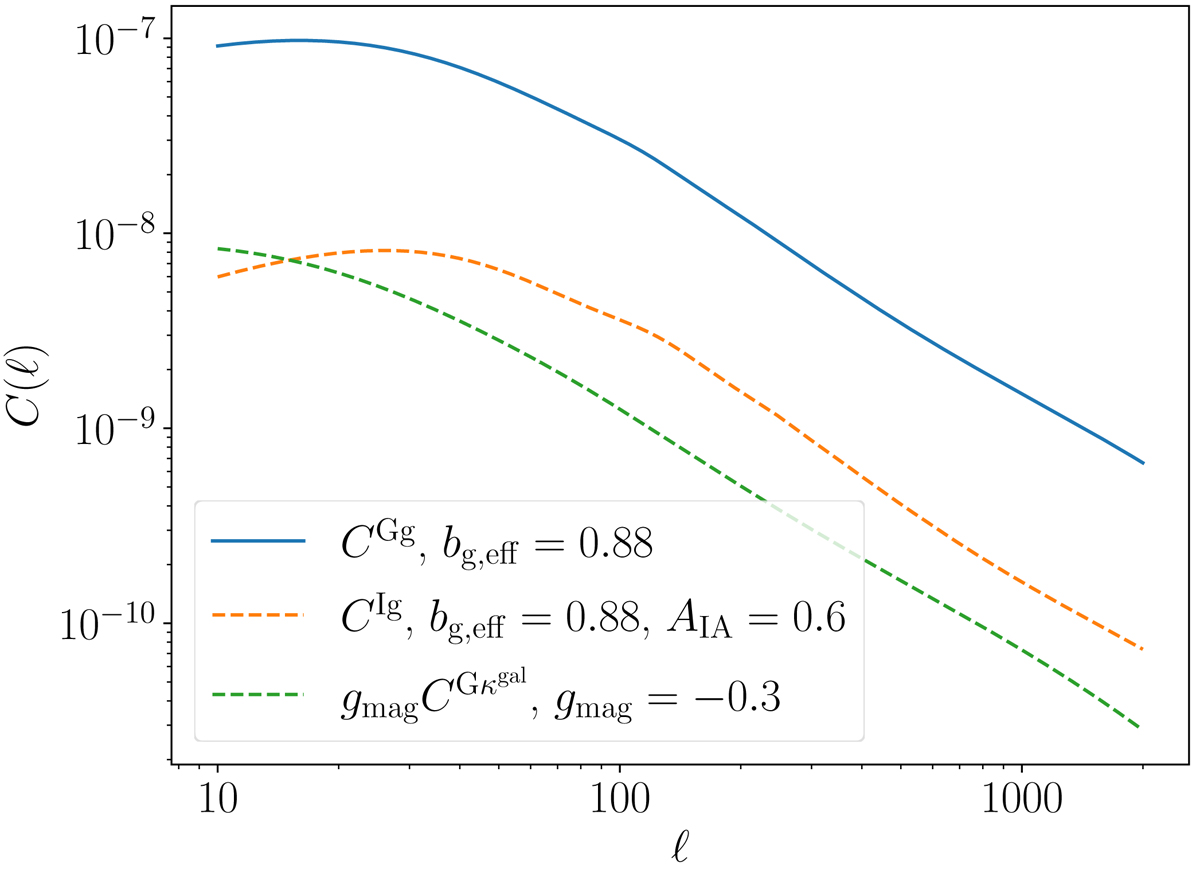
Fig. 2.
Download original image
Theoretical comparison between the galaxy-shear CGg(ℓ), galaxy-IA CIg(ℓ) and shear-magnification gmagCGκgal(ℓ) angular power spectra, with the best fit of our baseline analysis and the redshift distribution n(z) from KiDS-1000 0.5 < zP < 1.2 shear catalog. The dashed lines represent negative signals. This figure demonstrates that the magnification contamination is important in the self-calibration method for the high-z KiDS source sample.
Current usage metrics show cumulative count of Article Views (full-text article views including HTML views, PDF and ePub downloads, according to the available data) and Abstracts Views on Vision4Press platform.
Data correspond to usage on the plateform after 2015. The current usage metrics is available 48-96 hours after online publication and is updated daily on week days.
Initial download of the metrics may take a while.