Fig. 1.
Download original image
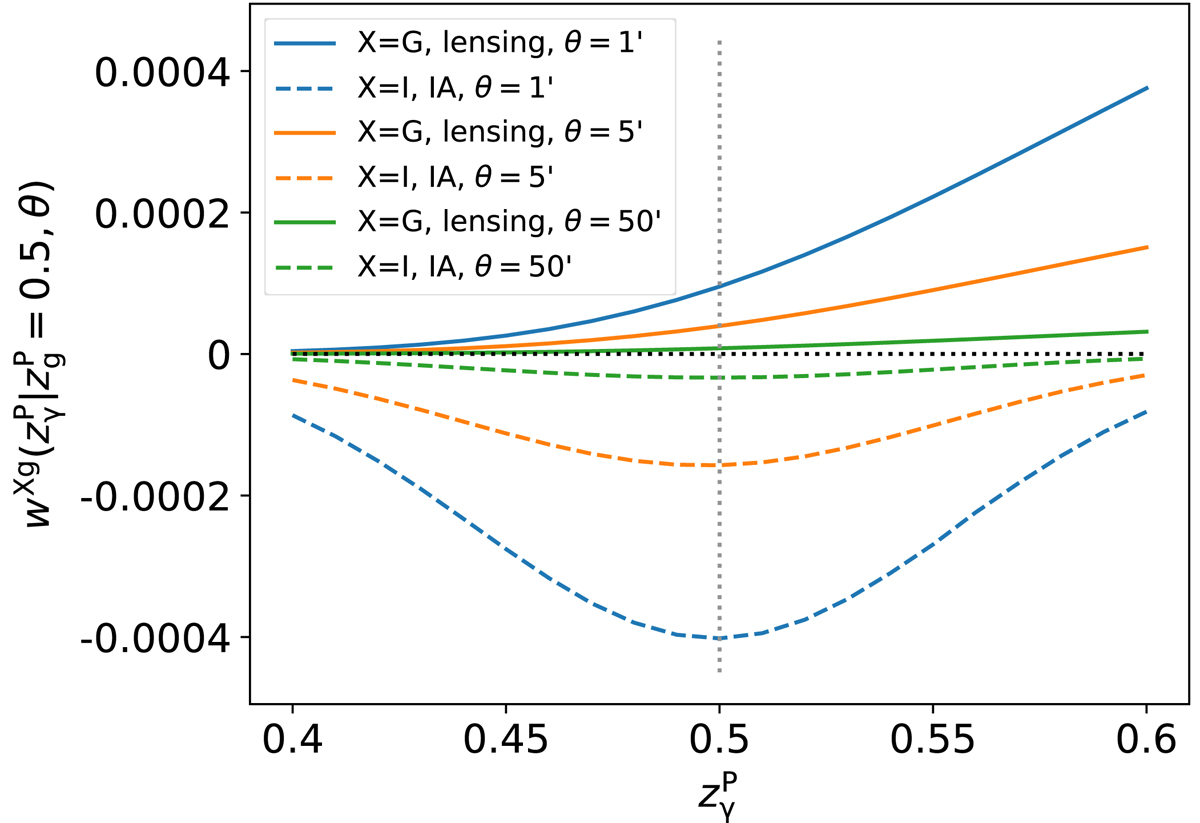
Toy model to illustrate the different redshift dependences for the lensing signal and the IA signal and to explain why the SC selection Eq. (8) works. We placed many lens galaxies at photo-z![]() (the grey dotted line), while allowing the photo-z of the source galaxies
(the grey dotted line), while allowing the photo-z of the source galaxies ![]() to change (x-axis) to evaluate the corresponding lensing correlation function wGg or IA correlation function wIg at different angular separation θ. The true-z has a Gaussian scatter of 0.04 (this number is chosen for display purposes, so that the lensing/IA signals have comparable maximum and minimum values) around the photo-z, for both source galaxies and lens galaxies. As the gravitational lensing shear is an optical shape that requires zg < zγ, it will have a non-symmetric power around
to change (x-axis) to evaluate the corresponding lensing correlation function wGg or IA correlation function wIg at different angular separation θ. The true-z has a Gaussian scatter of 0.04 (this number is chosen for display purposes, so that the lensing/IA signals have comparable maximum and minimum values) around the photo-z, for both source galaxies and lens galaxies. As the gravitational lensing shear is an optical shape that requires zg < zγ, it will have a non-symmetric power around ![]() , as the positive solid curves show. This also demonstrate QGg ≪ 1 according to Eq. (13). As the IA shape is a dynamical shape, it does not have requirements on the relative redshifts, leading to a symmetric power around
, as the positive solid curves show. This also demonstrate QGg ≪ 1 according to Eq. (13). As the IA shape is a dynamical shape, it does not have requirements on the relative redshifts, leading to a symmetric power around ![]() , as the negative dashed curves show. This also demonstrate QIg ∼ 1 according to Eq. (14). These relations hold for signals at different angular separations (different colors). The different IA models (which could deviate from Eq. (7) and with AIA = 1 being assumed) will only change the relative amplitudes of the negative signals at different scales, but not the redshift-dependency around
, as the negative dashed curves show. This also demonstrate QIg ∼ 1 according to Eq. (14). These relations hold for signals at different angular separations (different colors). The different IA models (which could deviate from Eq. (7) and with AIA = 1 being assumed) will only change the relative amplitudes of the negative signals at different scales, but not the redshift-dependency around ![]() . We note that at such a redshift range, the magnification signal is much smaller than the IA signal.
. We note that at such a redshift range, the magnification signal is much smaller than the IA signal.
Current usage metrics show cumulative count of Article Views (full-text article views including HTML views, PDF and ePub downloads, according to the available data) and Abstracts Views on Vision4Press platform.
Data correspond to usage on the plateform after 2015. The current usage metrics is available 48-96 hours after online publication and is updated daily on week days.
Initial download of the metrics may take a while.