Fig. 9.
Download original image
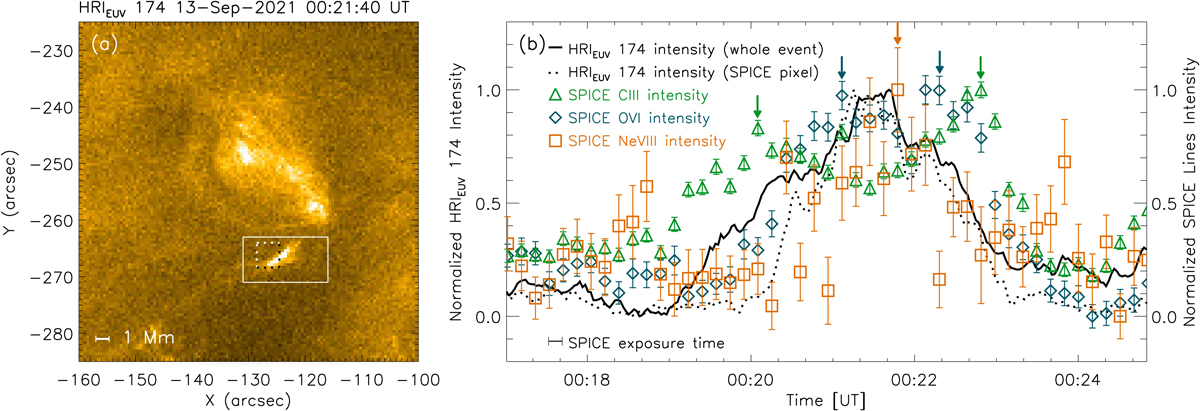
Same as Fig. 3, but for E-3 on 13 September 2021 and this time showing the C III (green), O VI (blue) and Ne VIII (orange) intensity evolution (normalized). Their peaks are marked by arrows in different colors. The SPICE exposure duration is 10 s in this case. An animation of panel a is available online.
Current usage metrics show cumulative count of Article Views (full-text article views including HTML views, PDF and ePub downloads, according to the available data) and Abstracts Views on Vision4Press platform.
Data correspond to usage on the plateform after 2015. The current usage metrics is available 48-96 hours after online publication and is updated daily on week days.
Initial download of the metrics may take a while.