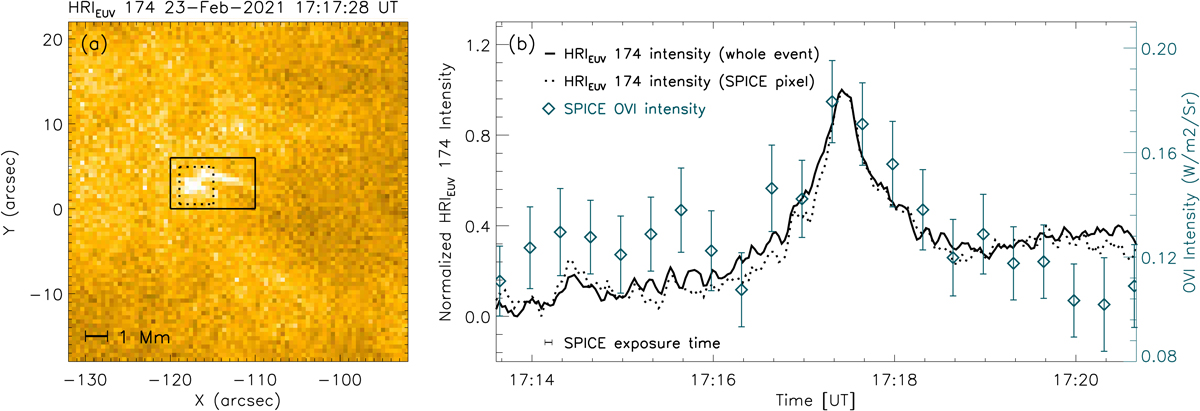
Fig. 3.
Download original image
EUI brightening (E-1). Panel a: HRIEUV image taken on 23 February 2021 at 17:17:28 UT, at about the time when the intensity of the EUI brightening peaked. The smaller dashed box shows the region covered by one SPICE-binned pixel (4″ × 4.392″) when the slit was at the second spatial step of the short raster. The O VI intensity at this pixel (blue diamonds) in panel b is calculated from Gaussian fits to the line in the SPICE data. The error bars were calculated from the uncertainties of the fitting parameters. This region was also used to calculate the HRIEUV intensity (dashed line) in panel b. The larger solid box shows the region we used to compute the light curve (solid line) shown in panel b. The horizontal bar in the lower left corner shows the SPICE exposure duration, which is about 4.7 s. An animation of panel a is available online.
Current usage metrics show cumulative count of Article Views (full-text article views including HTML views, PDF and ePub downloads, according to the available data) and Abstracts Views on Vision4Press platform.
Data correspond to usage on the plateform after 2015. The current usage metrics is available 48-96 hours after online publication and is updated daily on week days.
Initial download of the metrics may take a while.