Fig. 2.
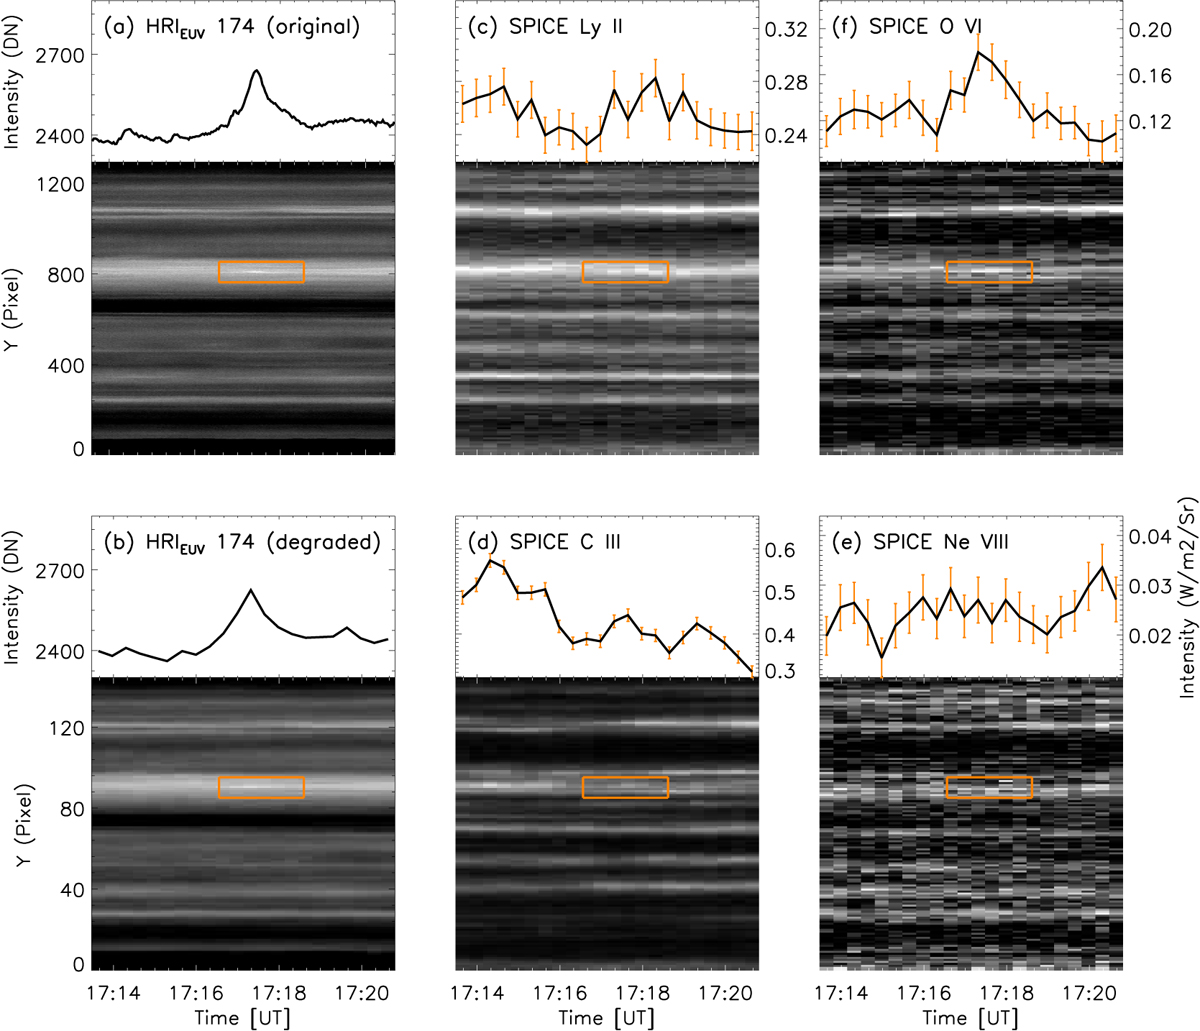
Download original image
Multithermal view of an EUI brightening (E-1) obtained on 23 February 2021. Panels a and b: time-slice plots of HRIEUV images with full and degraded (to SPICE spatial and temporal) resolution. Panels c–f: time-slice plots of the intensity from the Gaussian fitting results of Ne VIII, C III, Lyβ, and O VI. Orange boxes mark the position in which the EUI brightening appeared. The curves at the top of each panel show the intensities at this position vs. time. The error bars were calculated from the errors of the fitting parameters and are plotted in orange.
Current usage metrics show cumulative count of Article Views (full-text article views including HTML views, PDF and ePub downloads, according to the available data) and Abstracts Views on Vision4Press platform.
Data correspond to usage on the plateform after 2015. The current usage metrics is available 48-96 hours after online publication and is updated daily on week days.
Initial download of the metrics may take a while.