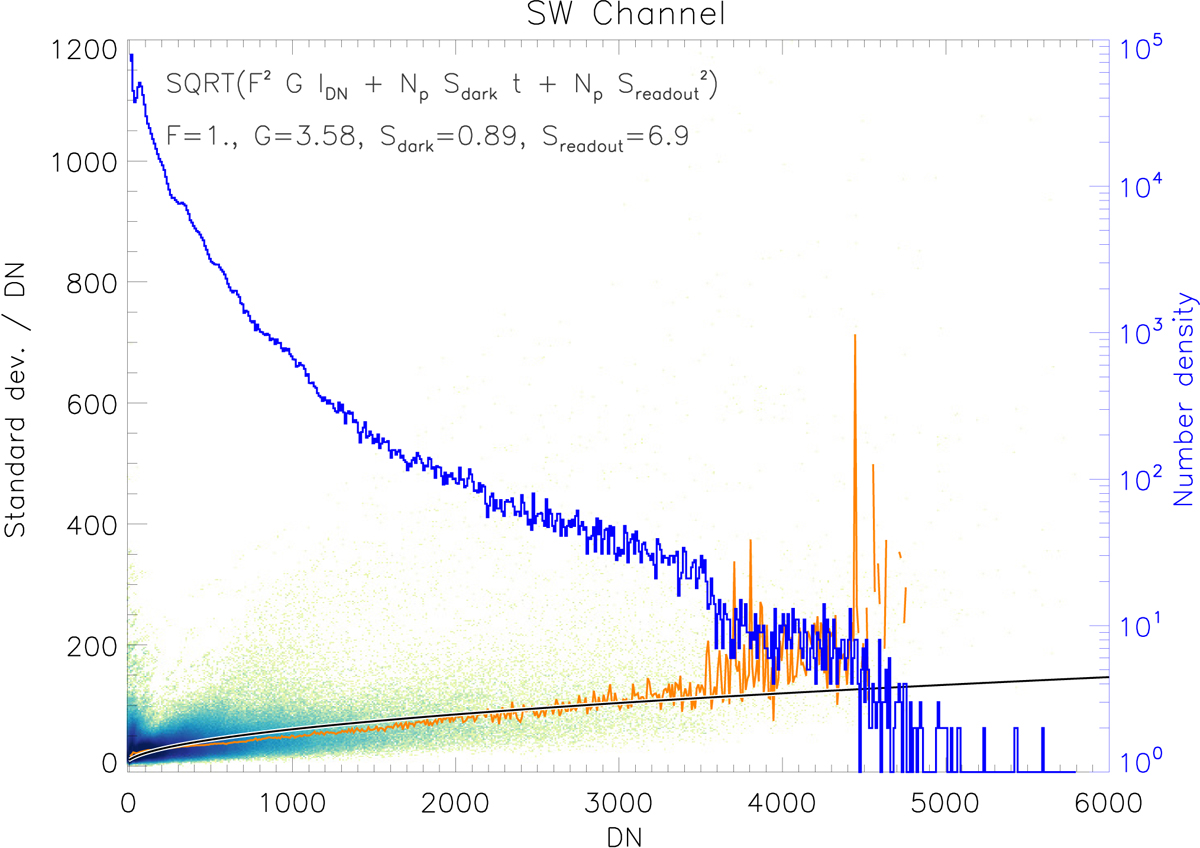
Fig. B.1.
Download original image
Noise estimate for unbinned SW data. The 2D histogram shows the standard deviation as a function of signal across the image. The orange line is the median to the data point in ten DN bins. The black line is the outcome of Eq. (B.2) for F = 1. The blue histogram shows the data number density.
Current usage metrics show cumulative count of Article Views (full-text article views including HTML views, PDF and ePub downloads, according to the available data) and Abstracts Views on Vision4Press platform.
Data correspond to usage on the plateform after 2015. The current usage metrics is available 48-96 hours after online publication and is updated daily on week days.
Initial download of the metrics may take a while.