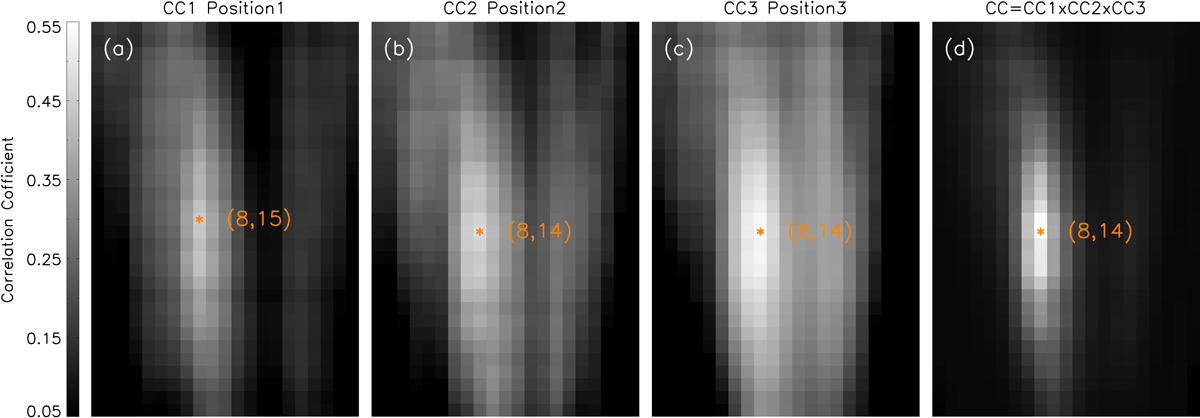
Fig. A.3.
Download original image
Correlation coefficient maps. Panels (a)-(c): Correlation coefficient maps between time-slice plots of the degraded HRIEUV time-slice image and the Ne VIII amplitude time-slice image at three positions. The color bar shows the range of correlation coefficients plotted on the left side. Panel (d): Map of the production of the correlation coefficient at three positions. The orange stars mark the slit position with the highest correlation coefficient. Its pixel coordinates are denoted in parentheses.
Current usage metrics show cumulative count of Article Views (full-text article views including HTML views, PDF and ePub downloads, according to the available data) and Abstracts Views on Vision4Press platform.
Data correspond to usage on the plateform after 2015. The current usage metrics is available 48-96 hours after online publication and is updated daily on week days.
Initial download of the metrics may take a while.