Fig. A.2.
Download original image
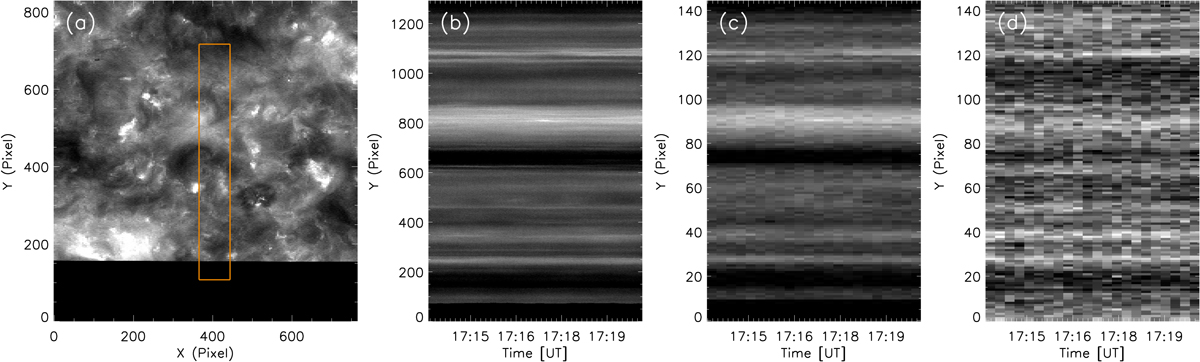
Example of the second step of data coalignment. Panel (a): HRIEUV image reprojected over the SPICE context raster using the WCS keywords in the file header. The orange box shows the region in which the SPICE slit was thought to be based on the results from the first coarse coalignment step. Panel (b): HRIEUV time-slice image with full resolution by selecting one slit position shown in panel (a). Panel (c): Same as panel (b), but the resolution is degraded to the SPICE imaging resolution. Panel (d): Time-slice image of the Ne VIII amplitude from Gaussian fitting results.
Current usage metrics show cumulative count of Article Views (full-text article views including HTML views, PDF and ePub downloads, according to the available data) and Abstracts Views on Vision4Press platform.
Data correspond to usage on the plateform after 2015. The current usage metrics is available 48-96 hours after online publication and is updated daily on week days.
Initial download of the metrics may take a while.