Fig. 2.
Download original image
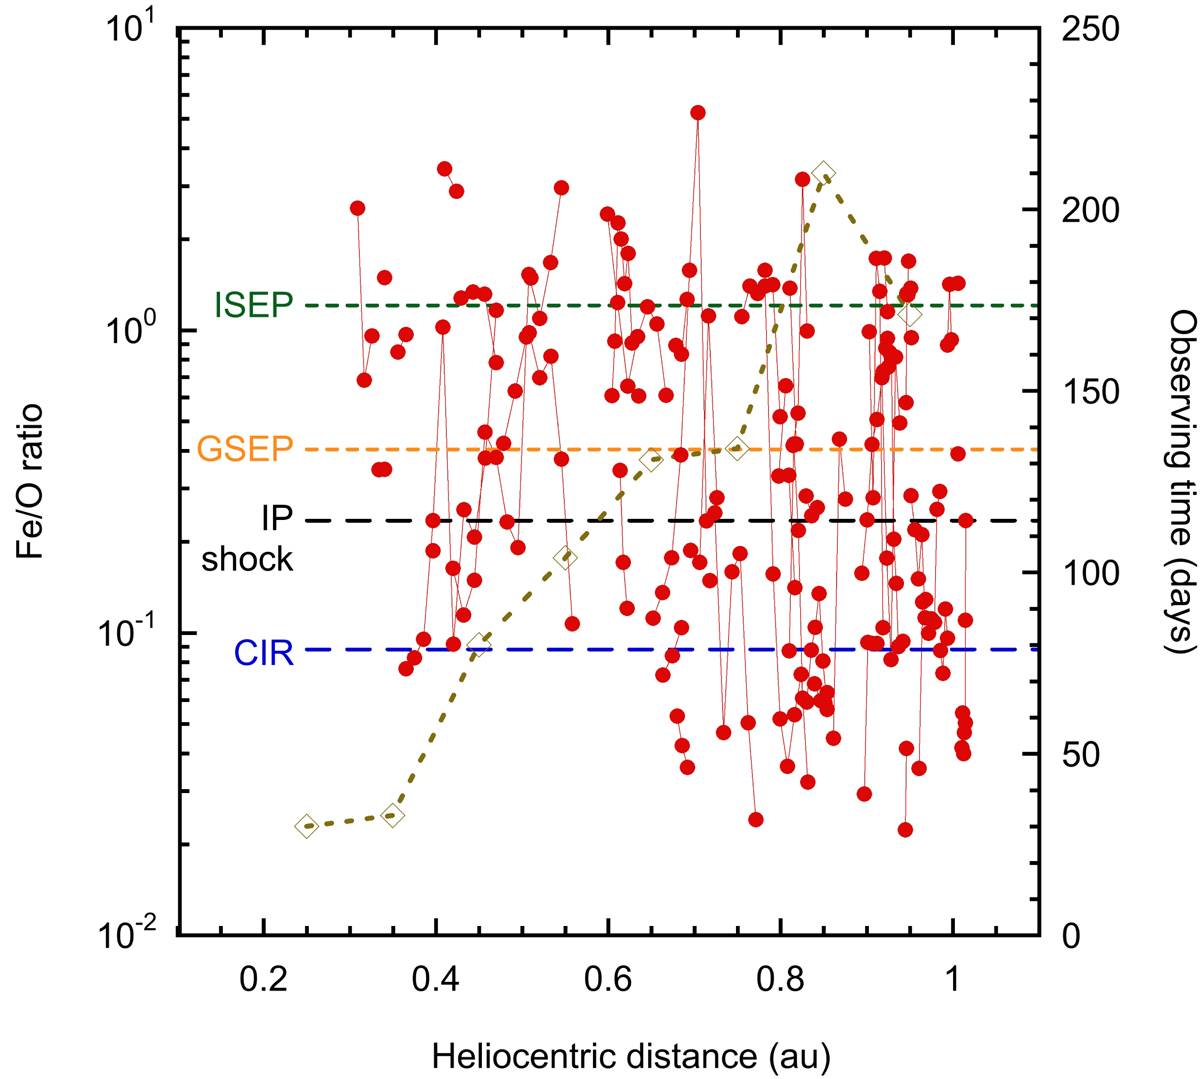
Ratio of 226−320 keV/nucleon Fe/O for each of the daily averages shown in Fig. 1. The horizontal lines show survey average values for ISEP events, GSEP events, IP shock events, and CIRs. The dashed olive line (right axis) shows the observing days. See the text for a discussion.
Current usage metrics show cumulative count of Article Views (full-text article views including HTML views, PDF and ePub downloads, according to the available data) and Abstracts Views on Vision4Press platform.
Data correspond to usage on the plateform after 2015. The current usage metrics is available 48-96 hours after online publication and is updated daily on week days.
Initial download of the metrics may take a while.