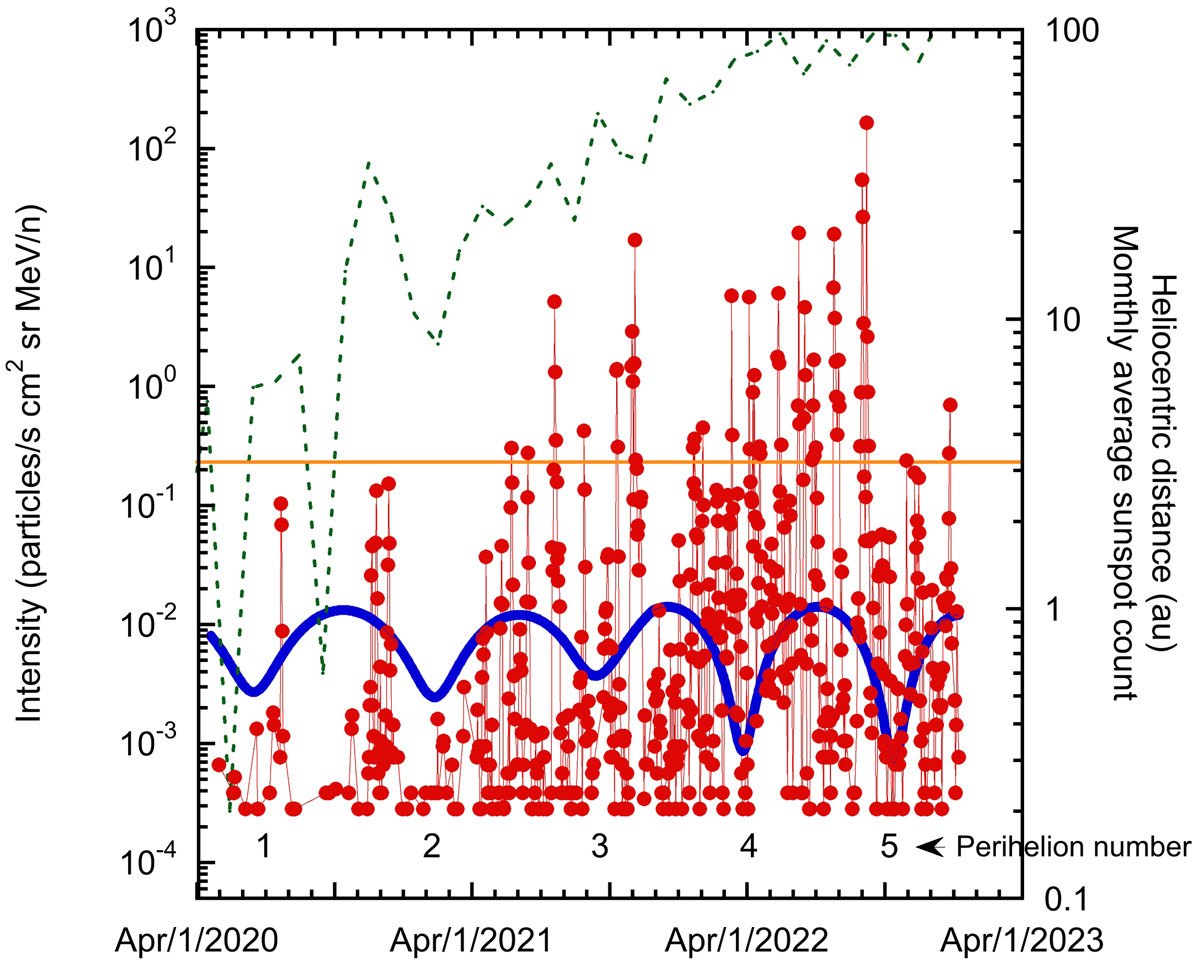
Fig. 1.
Download original image
Daily average EPD/SIS 226−320 keV/nucleon O intensities (filled red circles). The orange line is the threshold defining the semi-quiet time (see text). Right axis: heliospheric distance with five perihelia (blue line). The monthly sunspot number is shown by the dashed green line.
Current usage metrics show cumulative count of Article Views (full-text article views including HTML views, PDF and ePub downloads, according to the available data) and Abstracts Views on Vision4Press platform.
Data correspond to usage on the plateform after 2015. The current usage metrics is available 48-96 hours after online publication and is updated daily on week days.
Initial download of the metrics may take a while.