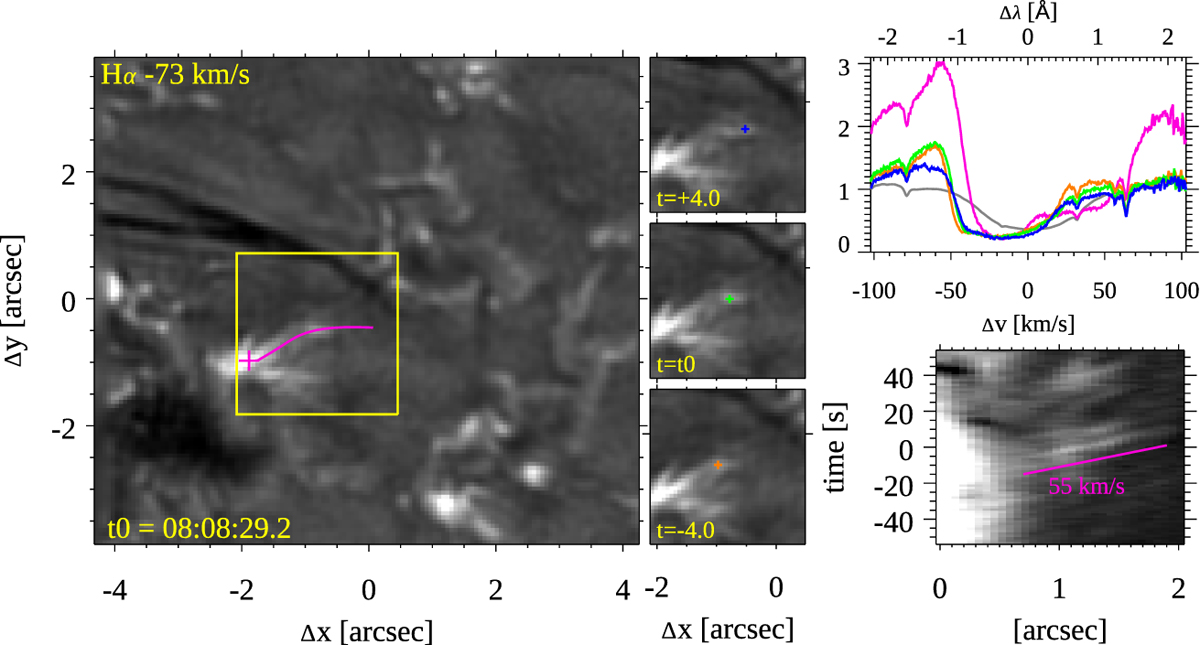
Fig. 7.
Download original image
Apparent motion of plasmoid-like blobs. The pink line in the large Hα wing image to the left traces the trajectory of some bright blobs. The st diagram for this trajectory is shown in the bottom right. The column of smaller images shows three different time steps; colored crosses mark the moving blob for which the respective spectral profiles are shown in the top-right panel. This blob has an apparent speed of about 55 km s−1, a speed that is indicated by a straight pink line in the st diagram. The pink profile in the top-right panel is a reference EB profile that is marked with the large pink cross in the large image to the left. The cross is near the origin of the trajectory for the st diagram. The gray profile is a reference profile that was constructed by averaging over the full FOV.
Current usage metrics show cumulative count of Article Views (full-text article views including HTML views, PDF and ePub downloads, according to the available data) and Abstracts Views on Vision4Press platform.
Data correspond to usage on the plateform after 2015. The current usage metrics is available 48-96 hours after online publication and is updated daily on week days.
Initial download of the metrics may take a while.