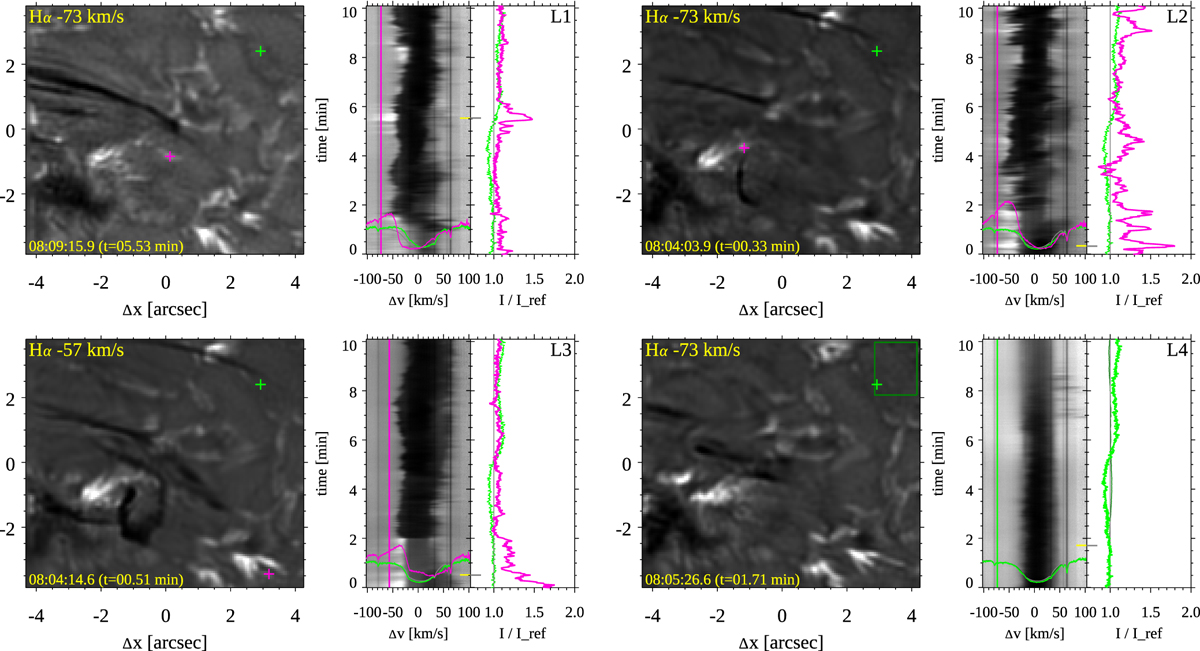
Fig. 6.
Download original image
Examples of rapid temporal variability in light curves close to EB clusters. The top row shows two examples in the vicinity of cluster EB1, and the bottom-left panel shows an example close to EB4. In the Hα wing images (left column), a pink cross marks the location of the λt diagram and the light curve (pink) in the right column. The Hα wing image is shown for a time when a blob can be seen at this location. Line profiles from this time are overplotted on the λt diagram. The light curve is at the wavelength marked with a vertical pink line in the λt diagram and noted in the top left of the MiHI wing image. The wavelength is selected to avoid excursions of the Hα line core as much as possible so that the light curve variations can be mostly attributed to EB variability. The green light curve serves as a reference and is drawn from the location marked with the green cross. The light curves are normalized by a reference light curve that is constructed by spatial averaging over the rectangular area in the top-right corner of the FOV that is marked in dark green in the bottom right. This spatially averaged spatial light curve is shown in dark green in the bottom-right light curve panel (L4) and is normalized to its temporally averaged value. A background gray line serves as a guide to I/Iref = 1.0. Animations of the figures for L1, L2, and L3 are available online.
Current usage metrics show cumulative count of Article Views (full-text article views including HTML views, PDF and ePub downloads, according to the available data) and Abstracts Views on Vision4Press platform.
Data correspond to usage on the plateform after 2015. The current usage metrics is available 48-96 hours after online publication and is updated daily on week days.
Initial download of the metrics may take a while.