Fig. 5.
Download original image
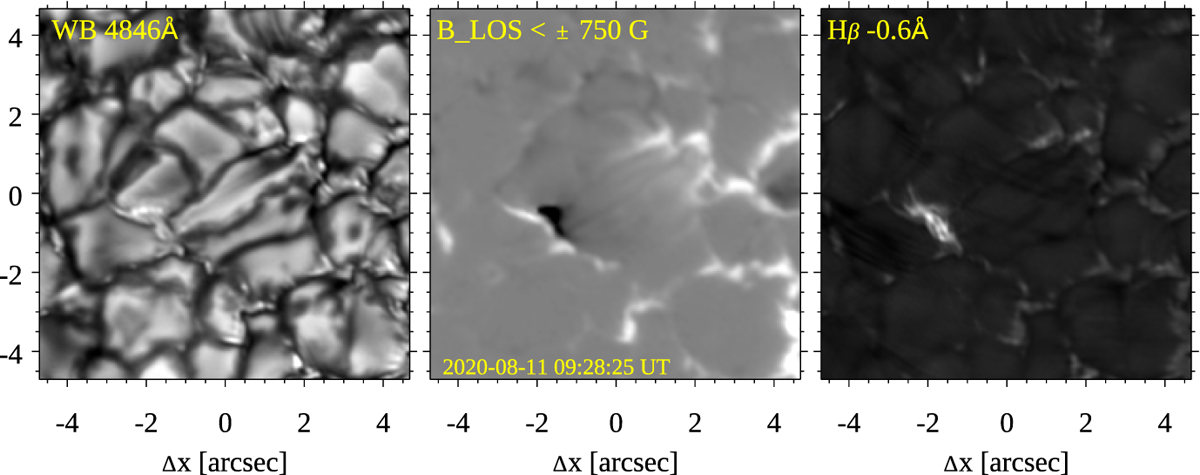
Episode of strong flux emergence with characteristic elongated granules in 11 August 2020 CHROMIS and CRISP observations. The left panel shows a wideband (FWHM 6.5 Å) image centered on 4846 Å. The middle panel shows a map of the magnetic field BLOS derived from inversions of the Fe I 6173 Å line. The right panel shows an Hβ blue wing image at the wavelength offset of the peak of the typical EB profile. This image is scaled linearly between the minimum and maximum. An animation of this figure is available online.
Current usage metrics show cumulative count of Article Views (full-text article views including HTML views, PDF and ePub downloads, according to the available data) and Abstracts Views on Vision4Press platform.
Data correspond to usage on the plateform after 2015. The current usage metrics is available 48-96 hours after online publication and is updated daily on week days.
Initial download of the metrics may take a while.