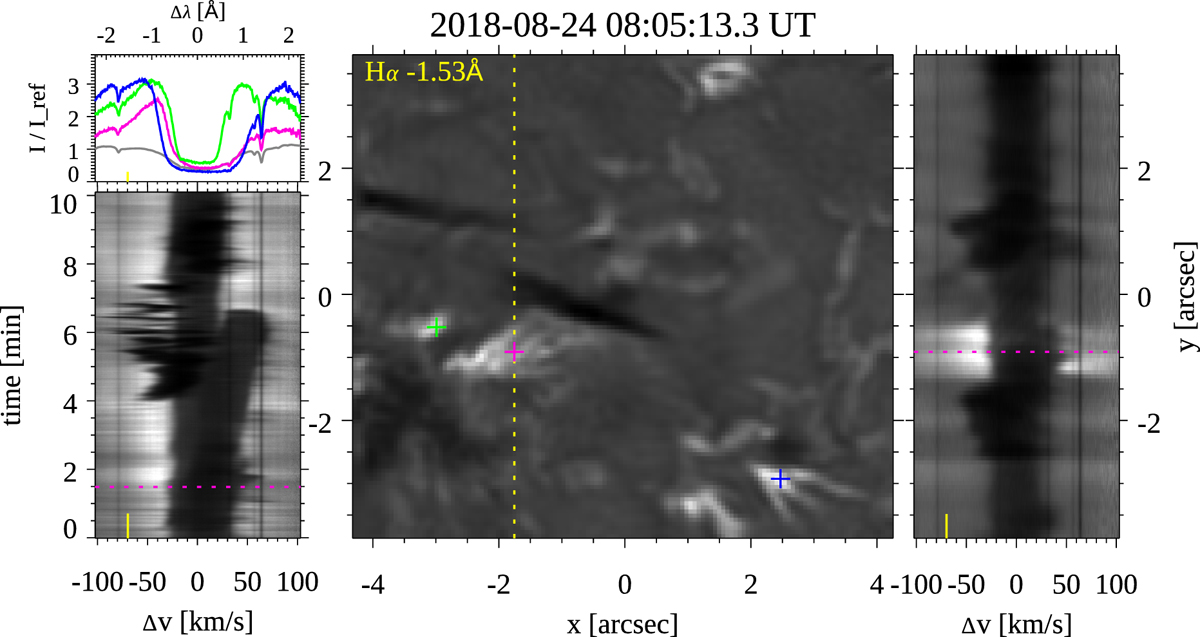
Fig. 3.
Download original image
Example EB profiles. The middle panel shows a MiHI Hα blue wing image. Colored crosses mark the locations of the spectral profiles shown in the top-left panel. Profiles are shown from EB clusters (see Fig. 1) EB1 (pink), EB2 (green), and EB4 (blue). The gray profile is averaged over the whole FOV and serves as a reference. All profiles are normalized to the far blue wing intensity of the reference profile. The lower-left panel shows the spectral evolution for the location marked with the pink cross as a λt diagram. The right panel shows the spectra along the dotted yellow line in the Hα wing image as a λy diagram. Horizontal dotted pink lines in the two diagrams mark the pink profile. Small vertical yellow markers indicate the spectral position of the Hα wing image. Two animations of this figure are available online, one showing the full temporal evolution and one showing a spectral line scan stepping through the full spectral range.
Current usage metrics show cumulative count of Article Views (full-text article views including HTML views, PDF and ePub downloads, according to the available data) and Abstracts Views on Vision4Press platform.
Data correspond to usage on the plateform after 2015. The current usage metrics is available 48-96 hours after online publication and is updated daily on week days.
Initial download of the metrics may take a while.