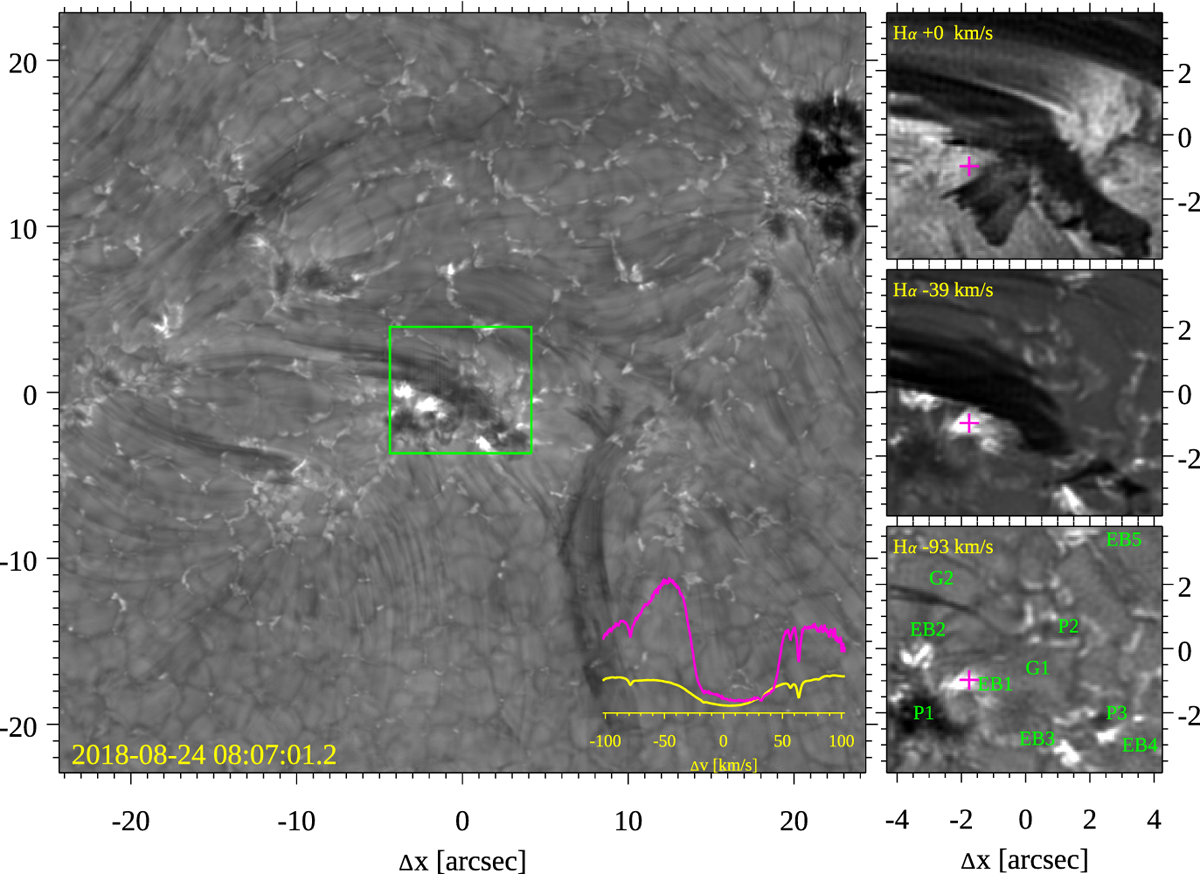
Fig. 2.
Download original image
Overview of the MiHI observations of AR12720 on 24 August 2018. The left panel shows an image from the Hα wideband context imager; the green box outlines the MiHI FOV. The column to the right shows MiHI images in the Hα core and two positions in the blue wing. Notable features are marked in the bottom-right panel: micro-pores (P1, P2, and P3), clusters with EBs (EB1 – 5), and elongated granules characteristic of strong flux emergence (G1 and G2). The pink cross marks the location in EB1 of the spectral profile shown in pink in the lower-right corner of the large context image. The yellow profile is a reference spectrum averaged over the full MiHI FOV. An animation of this figure is available online.
Current usage metrics show cumulative count of Article Views (full-text article views including HTML views, PDF and ePub downloads, according to the available data) and Abstracts Views on Vision4Press platform.
Data correspond to usage on the plateform after 2015. The current usage metrics is available 48-96 hours after online publication and is updated daily on week days.
Initial download of the metrics may take a while.