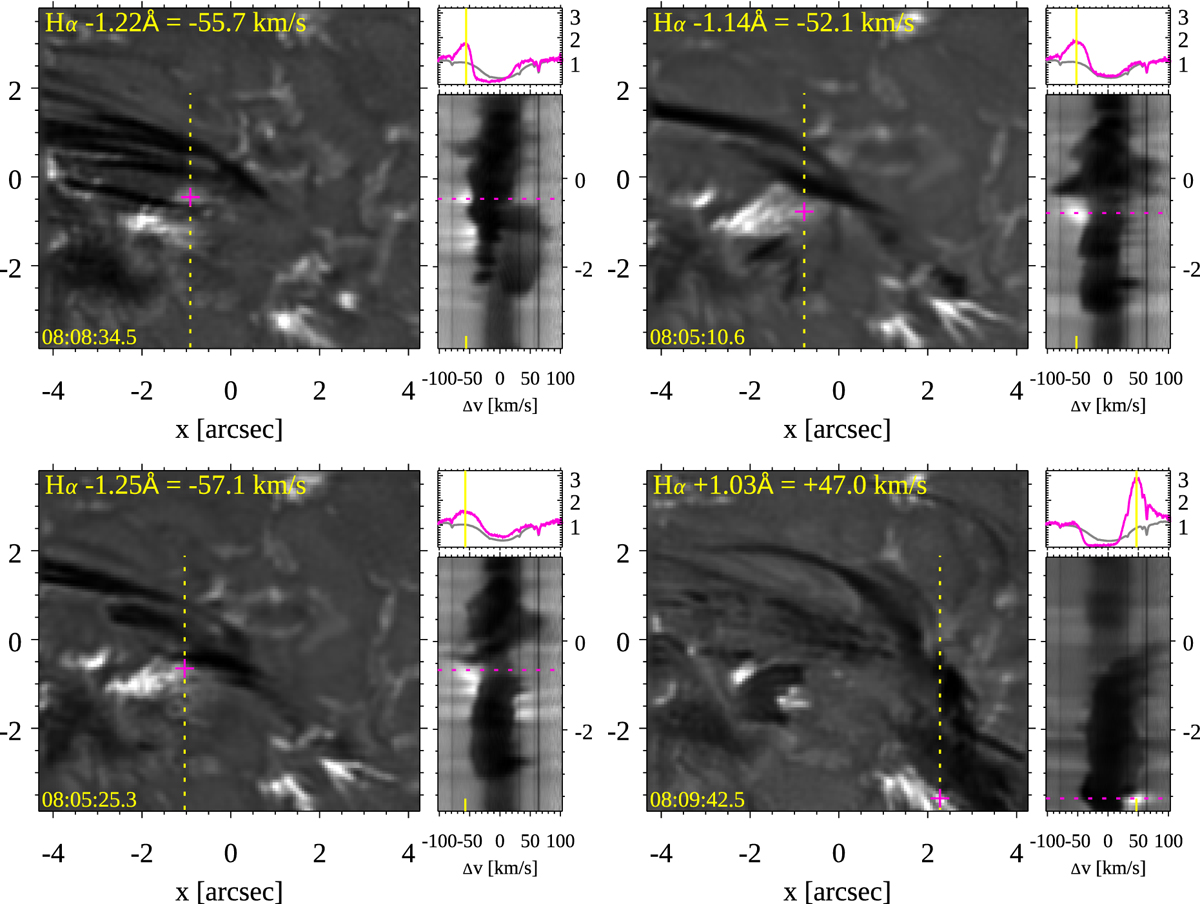
Fig. 10.
Download original image
Four examples of highly asymmetric spectral profiles that are suggestive of Doppler-shifted emission peaks. The pink cross in the Hα wing images (to the left) marks the location of the full spectral profile shown in the top right (pink profile). The gray profile is a reference profile averaged over the full MiHI FOV. The spectral profiles are normalized to the intensity at the shortest wavelength of the reference profile. The vertical dashed yellow line marks the location of the λy diagram shown to the right.
Current usage metrics show cumulative count of Article Views (full-text article views including HTML views, PDF and ePub downloads, according to the available data) and Abstracts Views on Vision4Press platform.
Data correspond to usage on the plateform after 2015. The current usage metrics is available 48-96 hours after online publication and is updated daily on week days.
Initial download of the metrics may take a while.