Fig. 1.
Download original image
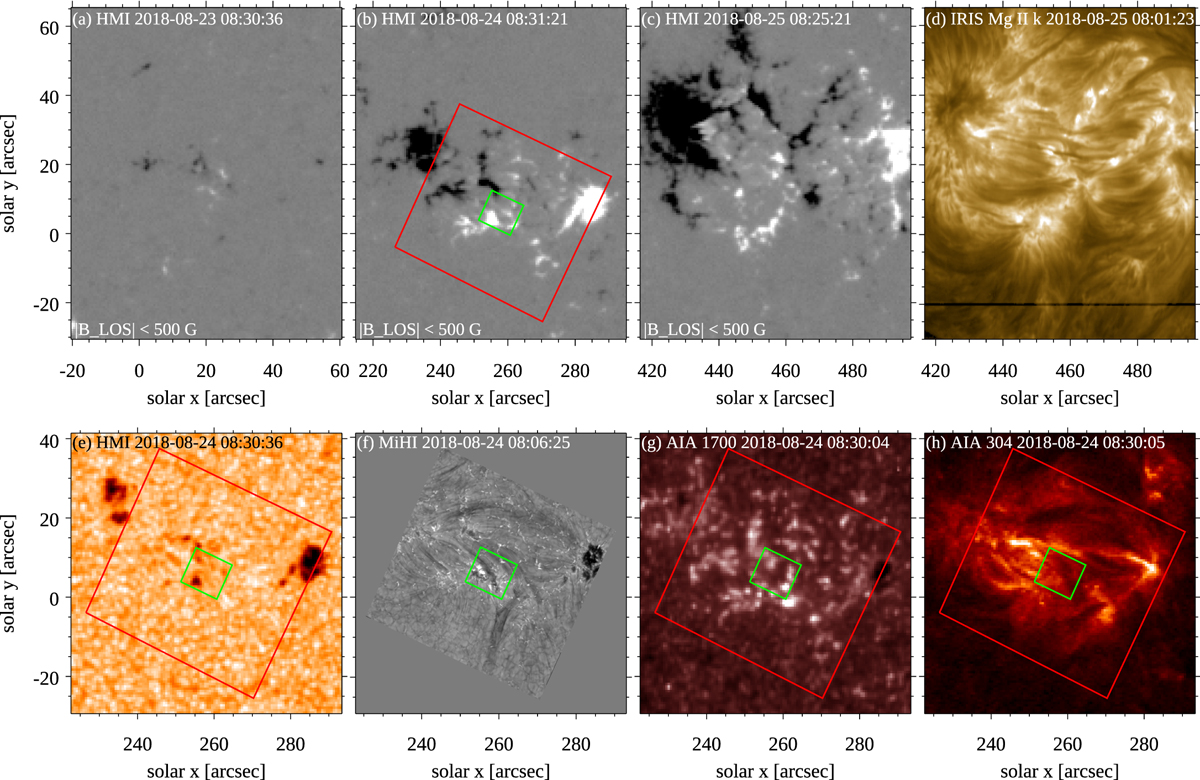
Extended context for the MiHI observations of 24 August 2018. Panels a–c show the emergence of AR12720 in HMI BLOS magnetic field maps over a period of 48 h. Panel b has the approximate locations of the FOVs of MiHI marked in green and of the context imager in red. Panel d shows an IRIS raster map at the nominal wavelength of Mg II k observed 24 h after the MiHI observations. In the bottom row, the MiHI Hα wideband context image in panel f is accompanied by the closest available SDO images: HMI continuum (e), AIA 1700 Å (g), and AIA 304 Å (h).
Current usage metrics show cumulative count of Article Views (full-text article views including HTML views, PDF and ePub downloads, according to the available data) and Abstracts Views on Vision4Press platform.
Data correspond to usage on the plateform after 2015. The current usage metrics is available 48-96 hours after online publication and is updated daily on week days.
Initial download of the metrics may take a while.