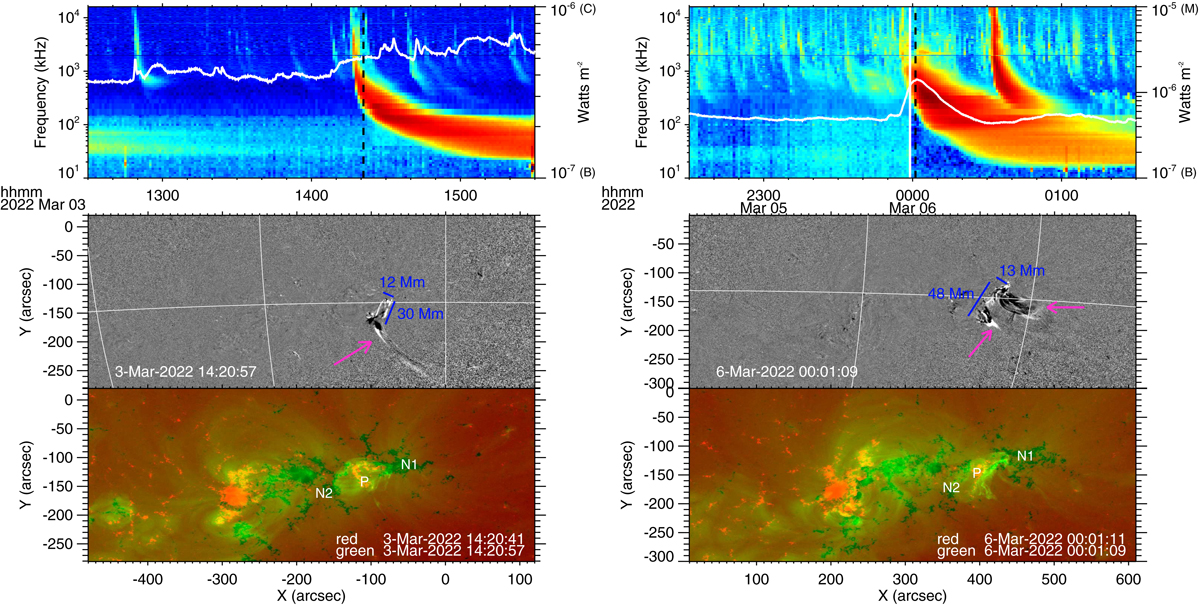
Fig. 4.
Download original image
Radio, soft X-ray, and EUV imaging observations of the solar source. The left (right) panels are for injection #2 (#5). Top: STEREO-A Waves radio spectrograms and GOES-16 X-ray fluxes at 1.0−8.0 Å (white curve). Color-coding in the radio spectrograms represents E intensity (dB > background). The right axis labels B, C, and M mark flare classes. The vertical dashed black lines mark the times of images in the middle and bottom panels. Middle: SDO AIA 211 Å 1-min running-difference images. The heliographic longitude-latitude grid has a spacing of 15°. The arrows mark a jet (left panel), as well as jet-like and wider eruptions (right panel). Line segments mark the rough estimate of the projected size of the source of the jet (right panel) and the eruption (left panel) at the time of the 211 Å intensity maximum. Bottom panels: SDO AIA 211 Å corresponds to green, and the SDO HMI line-of-sight magnetic field (scaled to ±200 G) corresponds to black and red tinted colors. Furthermore, N1 and N2 mark negative and P positive polarity patches in the 3He-rich SEP source. Animations of AIA 211 Å 12 s direct images corresponding to the bottom panels are available online.
Current usage metrics show cumulative count of Article Views (full-text article views including HTML views, PDF and ePub downloads, according to the available data) and Abstracts Views on Vision4Press platform.
Data correspond to usage on the plateform after 2015. The current usage metrics is available 48-96 hours after online publication and is updated daily on week days.
Initial download of the metrics may take a while.