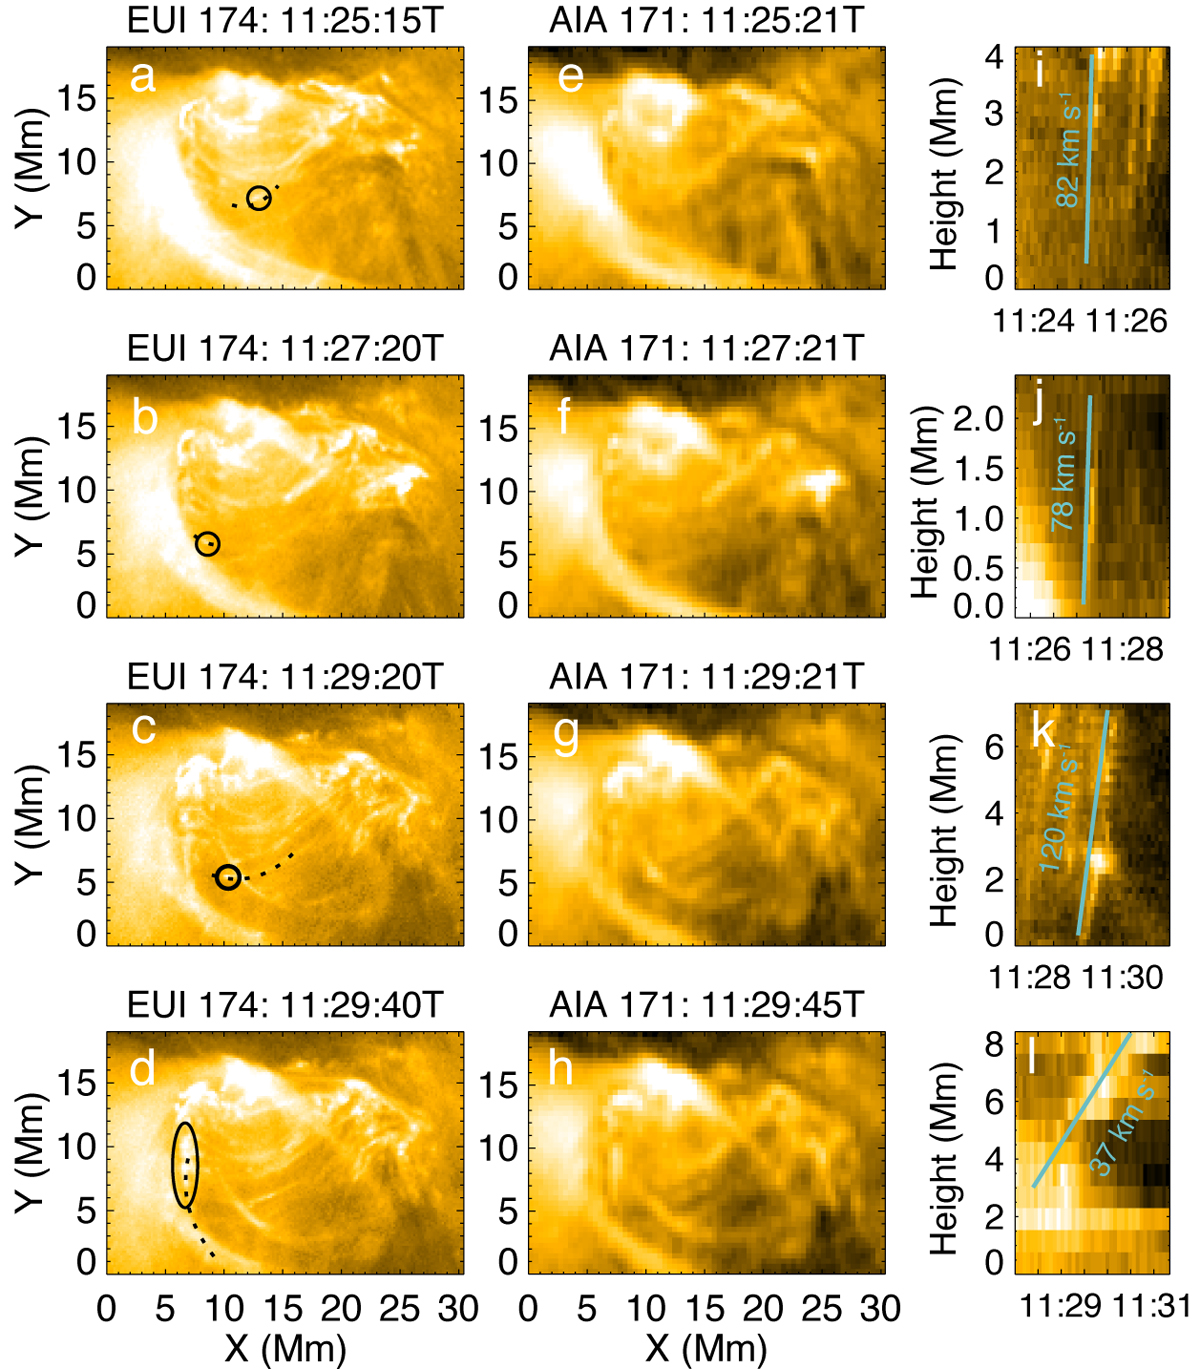
Fig. 4.

Download original image
Details of the blobs. Panels a–d: EUI HRIEUV 174 Å images. The appearance of four blobs is indicated by black ellipses. The dashed black curves delineate their trajectories. Panels e–h: AIA 171 Å images at nearly the same time as panels a–d. Panels i–l: Time-distance plots of the EUI HRIEUV 174 Å images showing the fast-moving blobs corresponding to panels a–d.
Current usage metrics show cumulative count of Article Views (full-text article views including HTML views, PDF and ePub downloads, according to the available data) and Abstracts Views on Vision4Press platform.
Data correspond to usage on the plateform after 2015. The current usage metrics is available 48-96 hours after online publication and is updated daily on week days.
Initial download of the metrics may take a while.


