Fig. 1.

Download original image
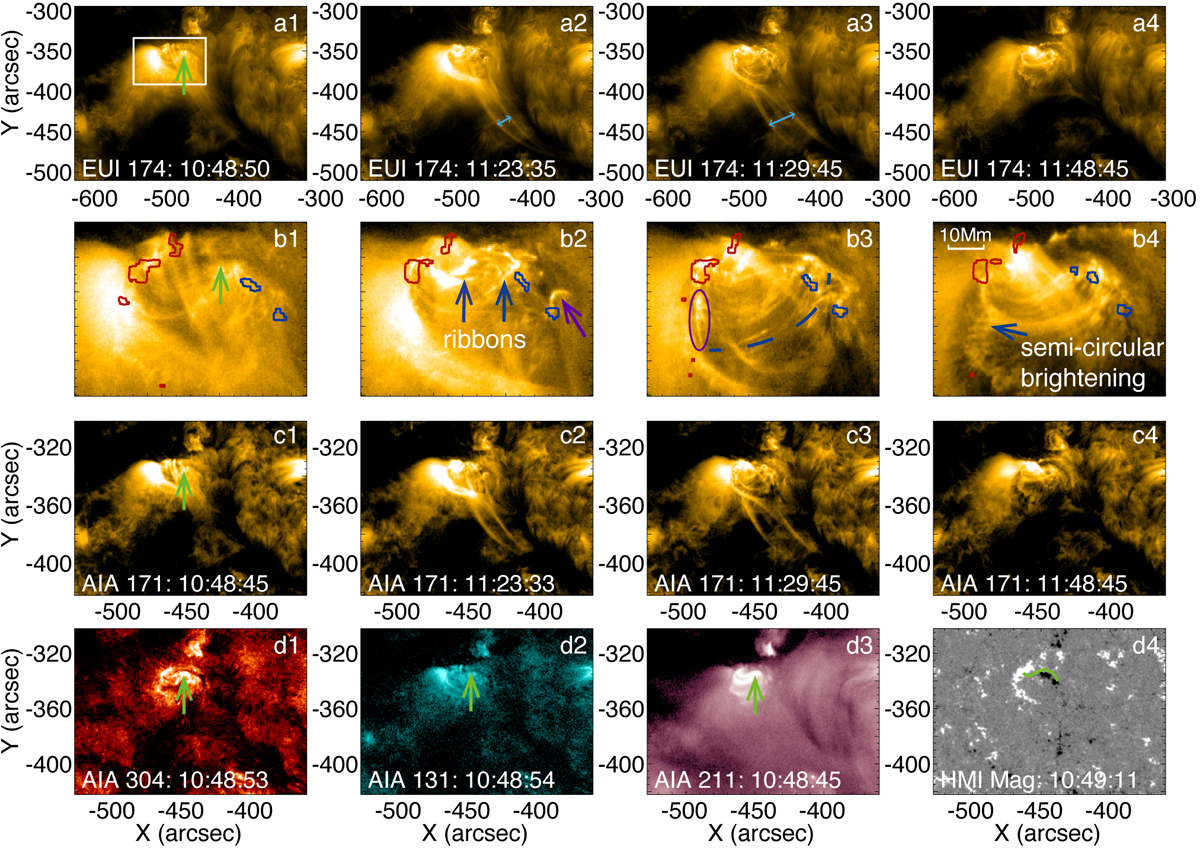
Overview of observations. a. Time sequence of HRIEUV 174 Å images showing the temporal evolution of the mini-filament eruption. The light blue arrows in panels a2 and a3 show the widths of the ambient loops. b. Zoom-in of the mini-filament eruption (white box in panel a1) overlaid with the contours (±40 G) of the HMI LOS magnetogram, with the positive (negative) in red (blue). The bright ribbons and semi-circular brightening (arrows in dark blue) are pointed out in panels b2 and b4, respectively. The arrow in purple indicates the brightening at the mini-filament footpoint. The dashed dark blue line denotes the post-eruption loops in panel b3. The purple ellipse in panel b3 highlights a plasma blob that is analyzed in detail in Fig. 4d. Row c: AIA 171 Å images showing the mini-filament eruption. Row d: AIA 304 Å, 131 Å, 211 Å images, and HMI magnetogram at the moment before the eruption. The locations of the mini-filament are indicated by the arrows in green. The green curve in panel d4 represents the basic shape of the mini-filament. An animation for the evolution of the mini-filament eruption and its zoom-in at 174 Å is available online.
Current usage metrics show cumulative count of Article Views (full-text article views including HTML views, PDF and ePub downloads, according to the available data) and Abstracts Views on Vision4Press platform.
Data correspond to usage on the plateform after 2015. The current usage metrics is available 48-96 hours after online publication and is updated daily on week days.
Initial download of the metrics may take a while.


