Fig. 9
Download original image
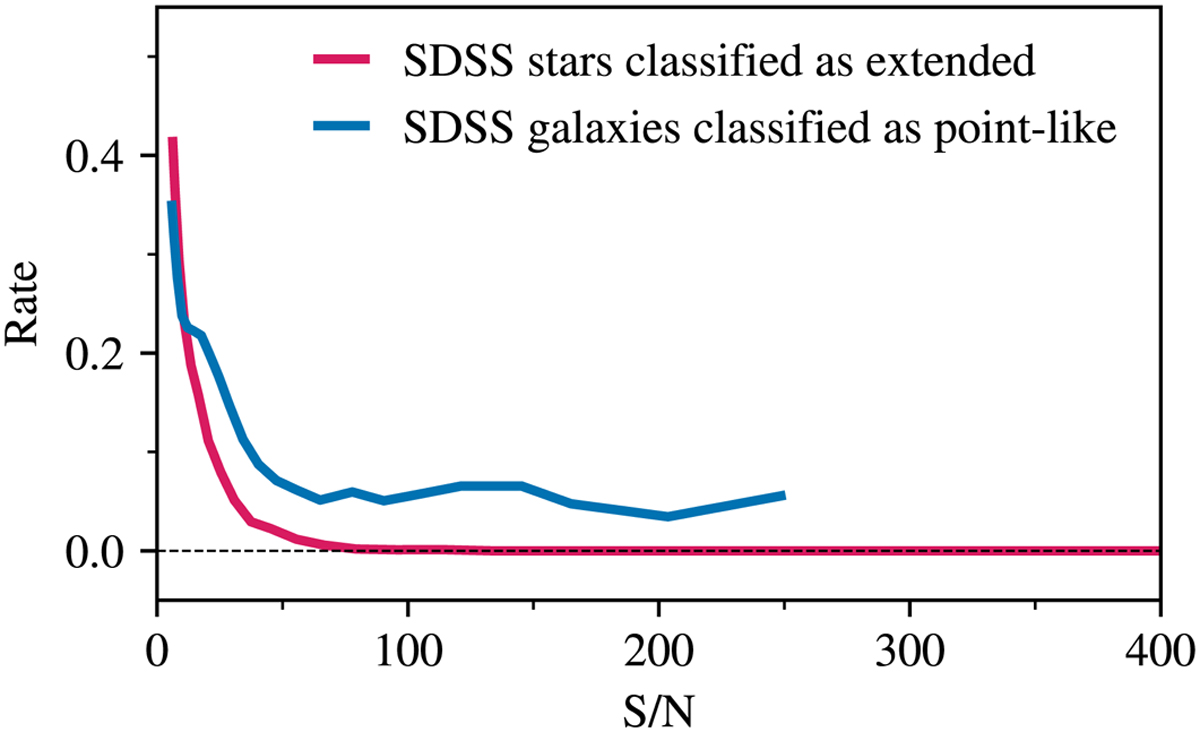
VISIONS source classification compared to the one found in SDSS for a randomly selected tile in the VIKING survey. The red line shows the fraction of sources at a given signal-to-noise ratio, which are classified as stars in SDSS DR16 but were assigned an extended morphology in the VISIONS pipeline. Similarly, the blue line depicts the fraction of SDSS galaxies that were identified as being point-like in VISIONS. For both stars and galaxies, the rate of misclassifications rises for sources with low signal-to-noise ratios. In addition, for SDSS galaxies we find a constant threshold at about 5% as a consequence of insufficient spatial resolution of the VISIONS survey.
Current usage metrics show cumulative count of Article Views (full-text article views including HTML views, PDF and ePub downloads, according to the available data) and Abstracts Views on Vision4Press platform.
Data correspond to usage on the plateform after 2015. The current usage metrics is available 48-96 hours after online publication and is updated daily on week days.
Initial download of the metrics may take a while.