Fig. 8
Download original image
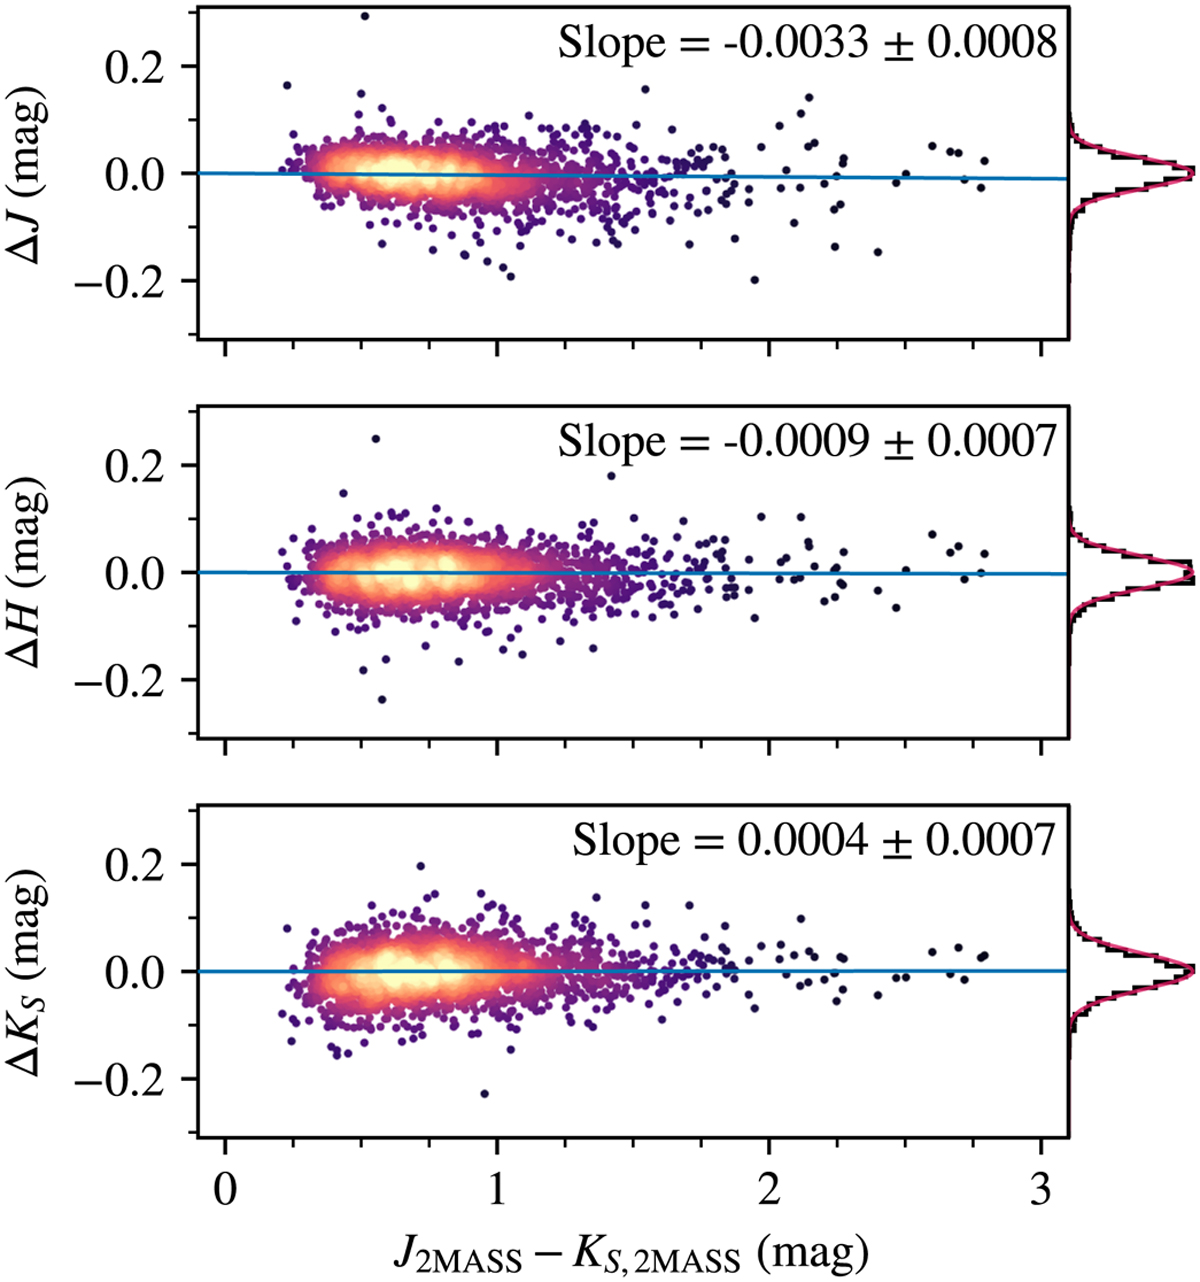
Evaluation of residual color terms in the VISIONS photometry. The panels show the difference between VISIONS and 2MASS source magnitudes as a function of their J–Ks color for the J (top), H (center), and Ks (bottom) bands. The blue line indicates a linear fit, with the slope reported in the top right of each panel. The data are projected into a histogram (black) on the right-hand side. The red line on top of the histograms shows a Gaussian determined by the mean measurement errors in the source catalogs.
Current usage metrics show cumulative count of Article Views (full-text article views including HTML views, PDF and ePub downloads, according to the available data) and Abstracts Views on Vision4Press platform.
Data correspond to usage on the plateform after 2015. The current usage metrics is available 48-96 hours after online publication and is updated daily on week days.
Initial download of the metrics may take a while.