Fig. 6
Download original image
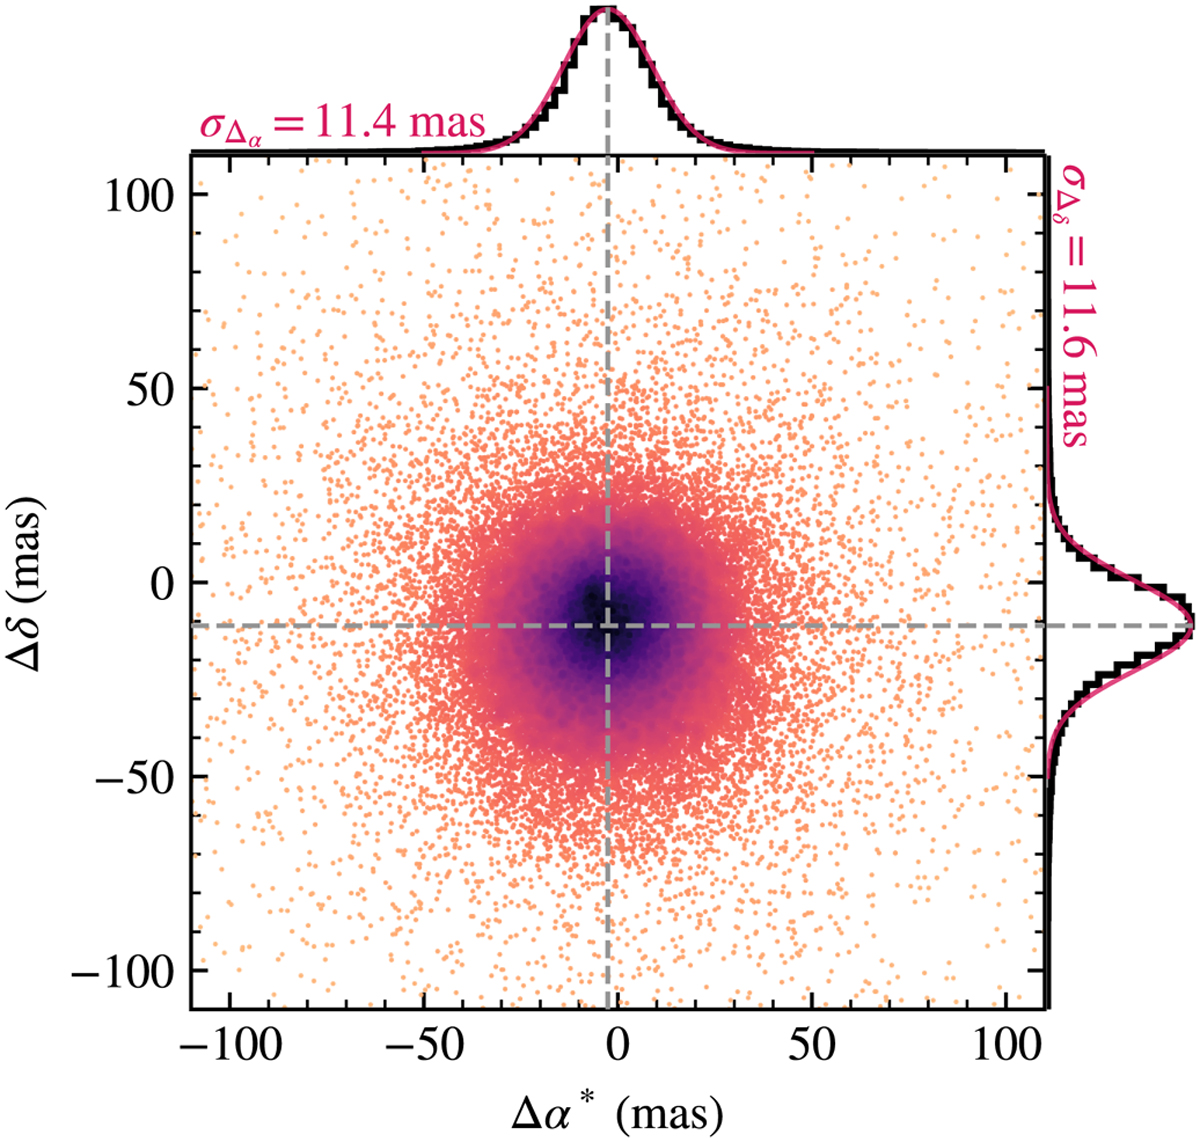
Comparison of source coordinates determined by VISIONS with the Gaia DR3 catalog for the Corona Australis control field. The y and x axes show the difference in right ascension and declination between Gaia and VISIONS, respectively. All astrometric solutions for VISIONS were computed against a Gaia frame that was shifted to the epoch of the individual observations. As a result, the distribution is not centered at the origin but coincides with the expected mean shift, marked by dashed gray lines between the two reference epochs (2016.0 for Gaia DR3 and 2018.36 for VISIONS). The black histograms on the top and on the right-hand side of the plot are well described by a Gaussian (shown in red) with a mean at the expected shift and a standard deviation corresponding to the astrometric error reported by Scamp.
Current usage metrics show cumulative count of Article Views (full-text article views including HTML views, PDF and ePub downloads, according to the available data) and Abstracts Views on Vision4Press platform.
Data correspond to usage on the plateform after 2015. The current usage metrics is available 48-96 hours after online publication and is updated daily on week days.
Initial download of the metrics may take a while.