Fig. 2
Download original image
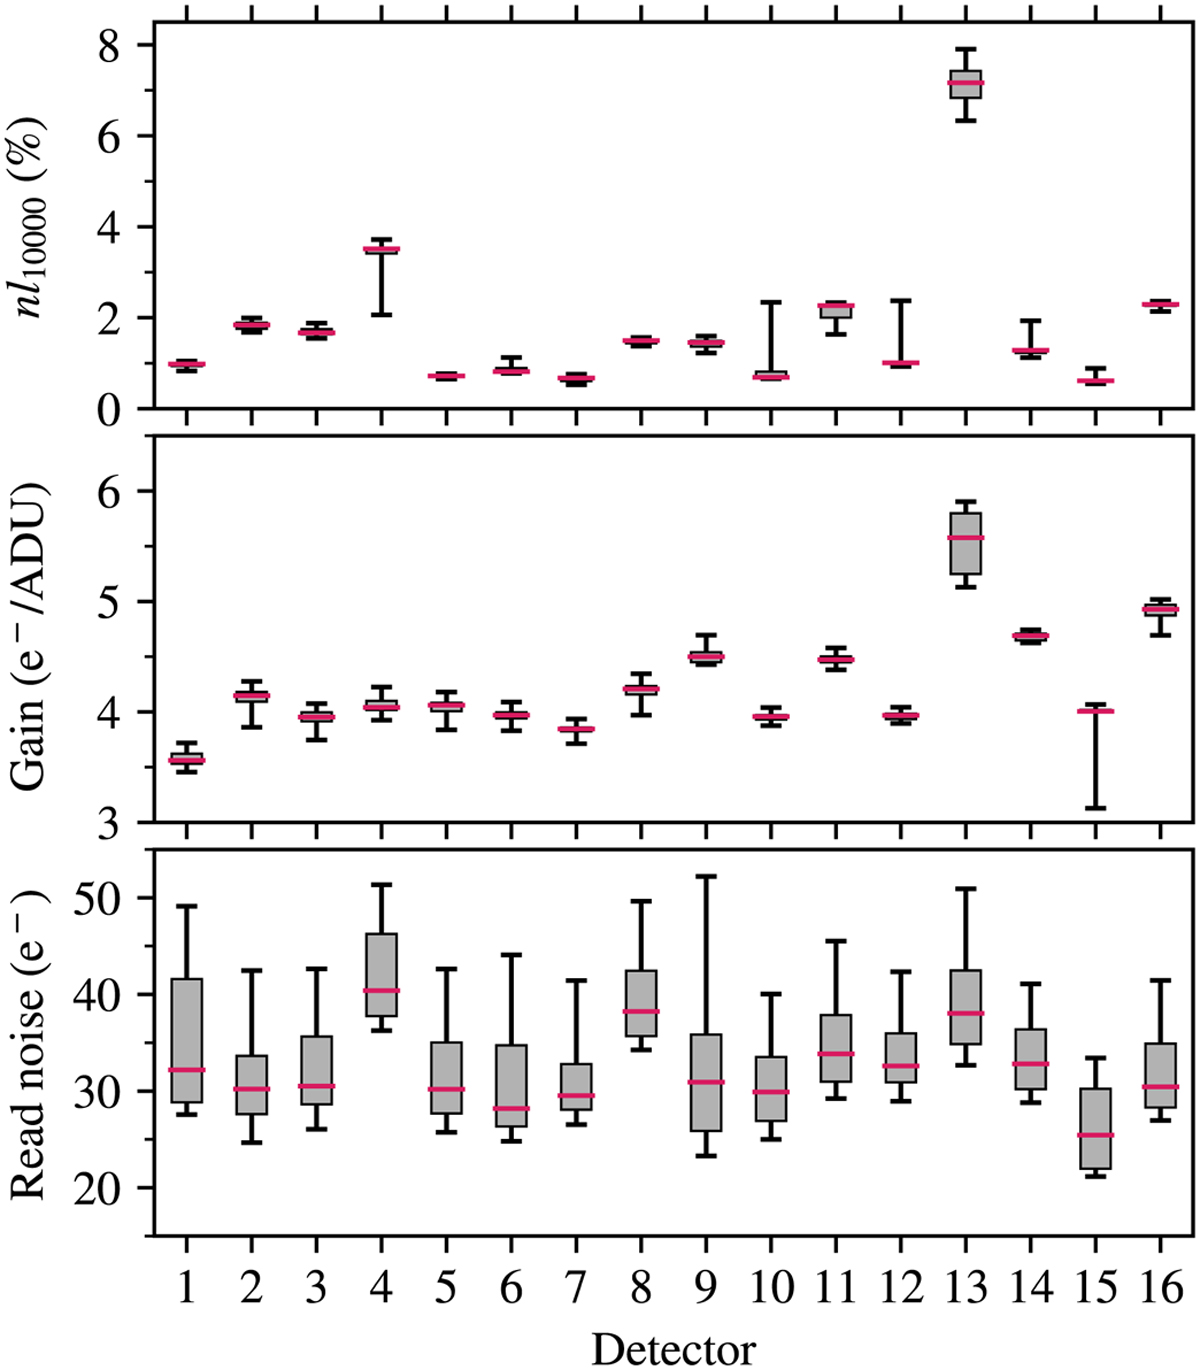
Box plot of detector characteristics as determined from the main calibration files that were built from observations obtained during the VISIONS program. In all panels, the red line marks the median value, the boxes indicate the interquartile range, and the whiskers represent the fifth and 95th percentile. The panel at the top displays the measured nonlinearity at 10 000 ADU (nl10 000) for each detector. The panels in the center and at the bottom show the gain and read noise, respectively.
Current usage metrics show cumulative count of Article Views (full-text article views including HTML views, PDF and ePub downloads, according to the available data) and Abstracts Views on Vision4Press platform.
Data correspond to usage on the plateform after 2015. The current usage metrics is available 48-96 hours after online publication and is updated daily on week days.
Initial download of the metrics may take a while.