Fig. 11
Download original image
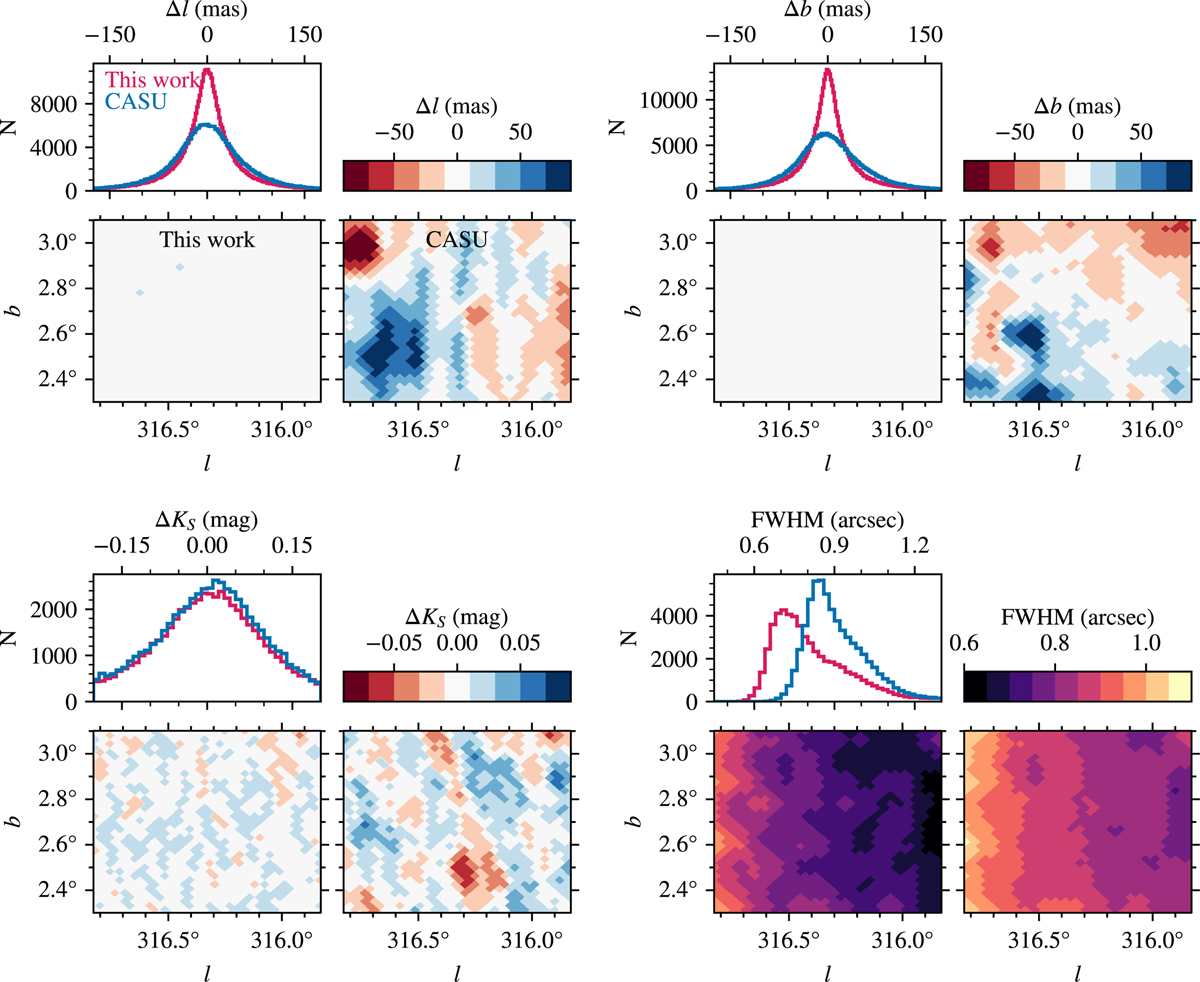
Performance comparison between the VISIONS pipeline and the CASU infrastructure for a randomly selected tile in the VVV survey. The four distinct groups show histograms and spatial variability in the Galactic frame of coordinates relative to Gaia (top panel groups), KS -band photometry compared to 2MASS (bottom left), and the reported image quality parametrized by the stellar FWHM (bottom right). The red and blue histograms show the respective measurement distributions for the VISIONS and CASU pipelines. Concerning the spatial distributions, the panels on the bottom left and right-hand side show the properties derived by the VISIONS and CASU workflows.
Current usage metrics show cumulative count of Article Views (full-text article views including HTML views, PDF and ePub downloads, according to the available data) and Abstracts Views on Vision4Press platform.
Data correspond to usage on the plateform after 2015. The current usage metrics is available 48-96 hours after online publication and is updated daily on week days.
Initial download of the metrics may take a while.