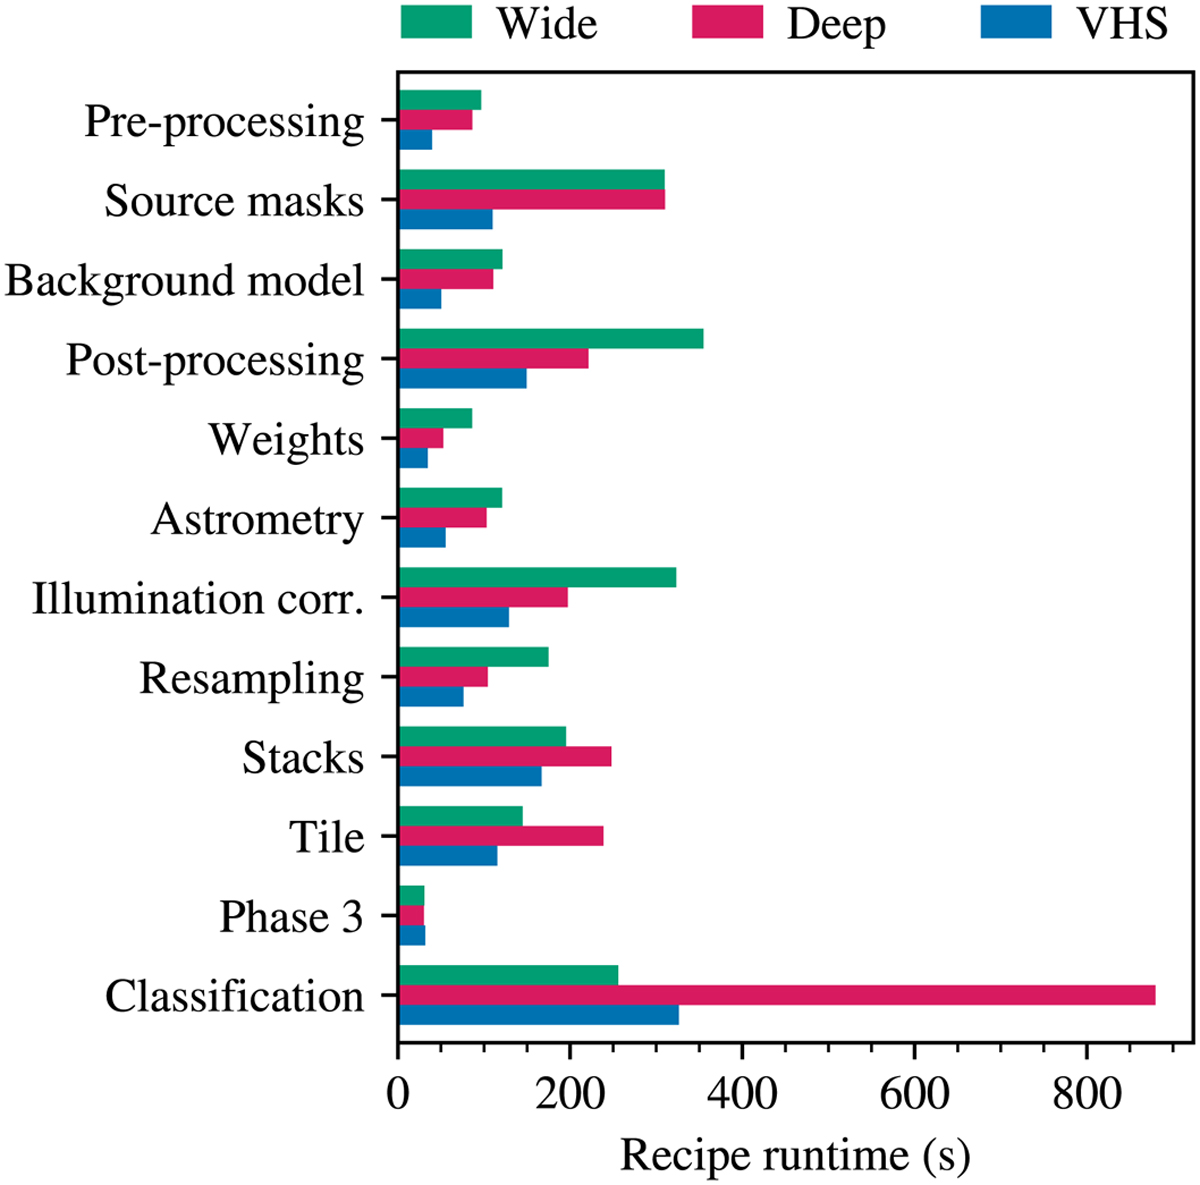
Fig. 10
Download original image
Pipeline performance benchmark for three typical observation blocks in the VISIONS program. The horizontal bars show the recipe runtimes for a set of wide data in green, deep data in red, and a VHS sequence in blue. The processing time depends on the number of observed pawprints and the number of extracted sources.
Current usage metrics show cumulative count of Article Views (full-text article views including HTML views, PDF and ePub downloads, according to the available data) and Abstracts Views on Vision4Press platform.
Data correspond to usage on the plateform after 2015. The current usage metrics is available 48-96 hours after online publication and is updated daily on week days.
Initial download of the metrics may take a while.