Fig. 8.
Download original image
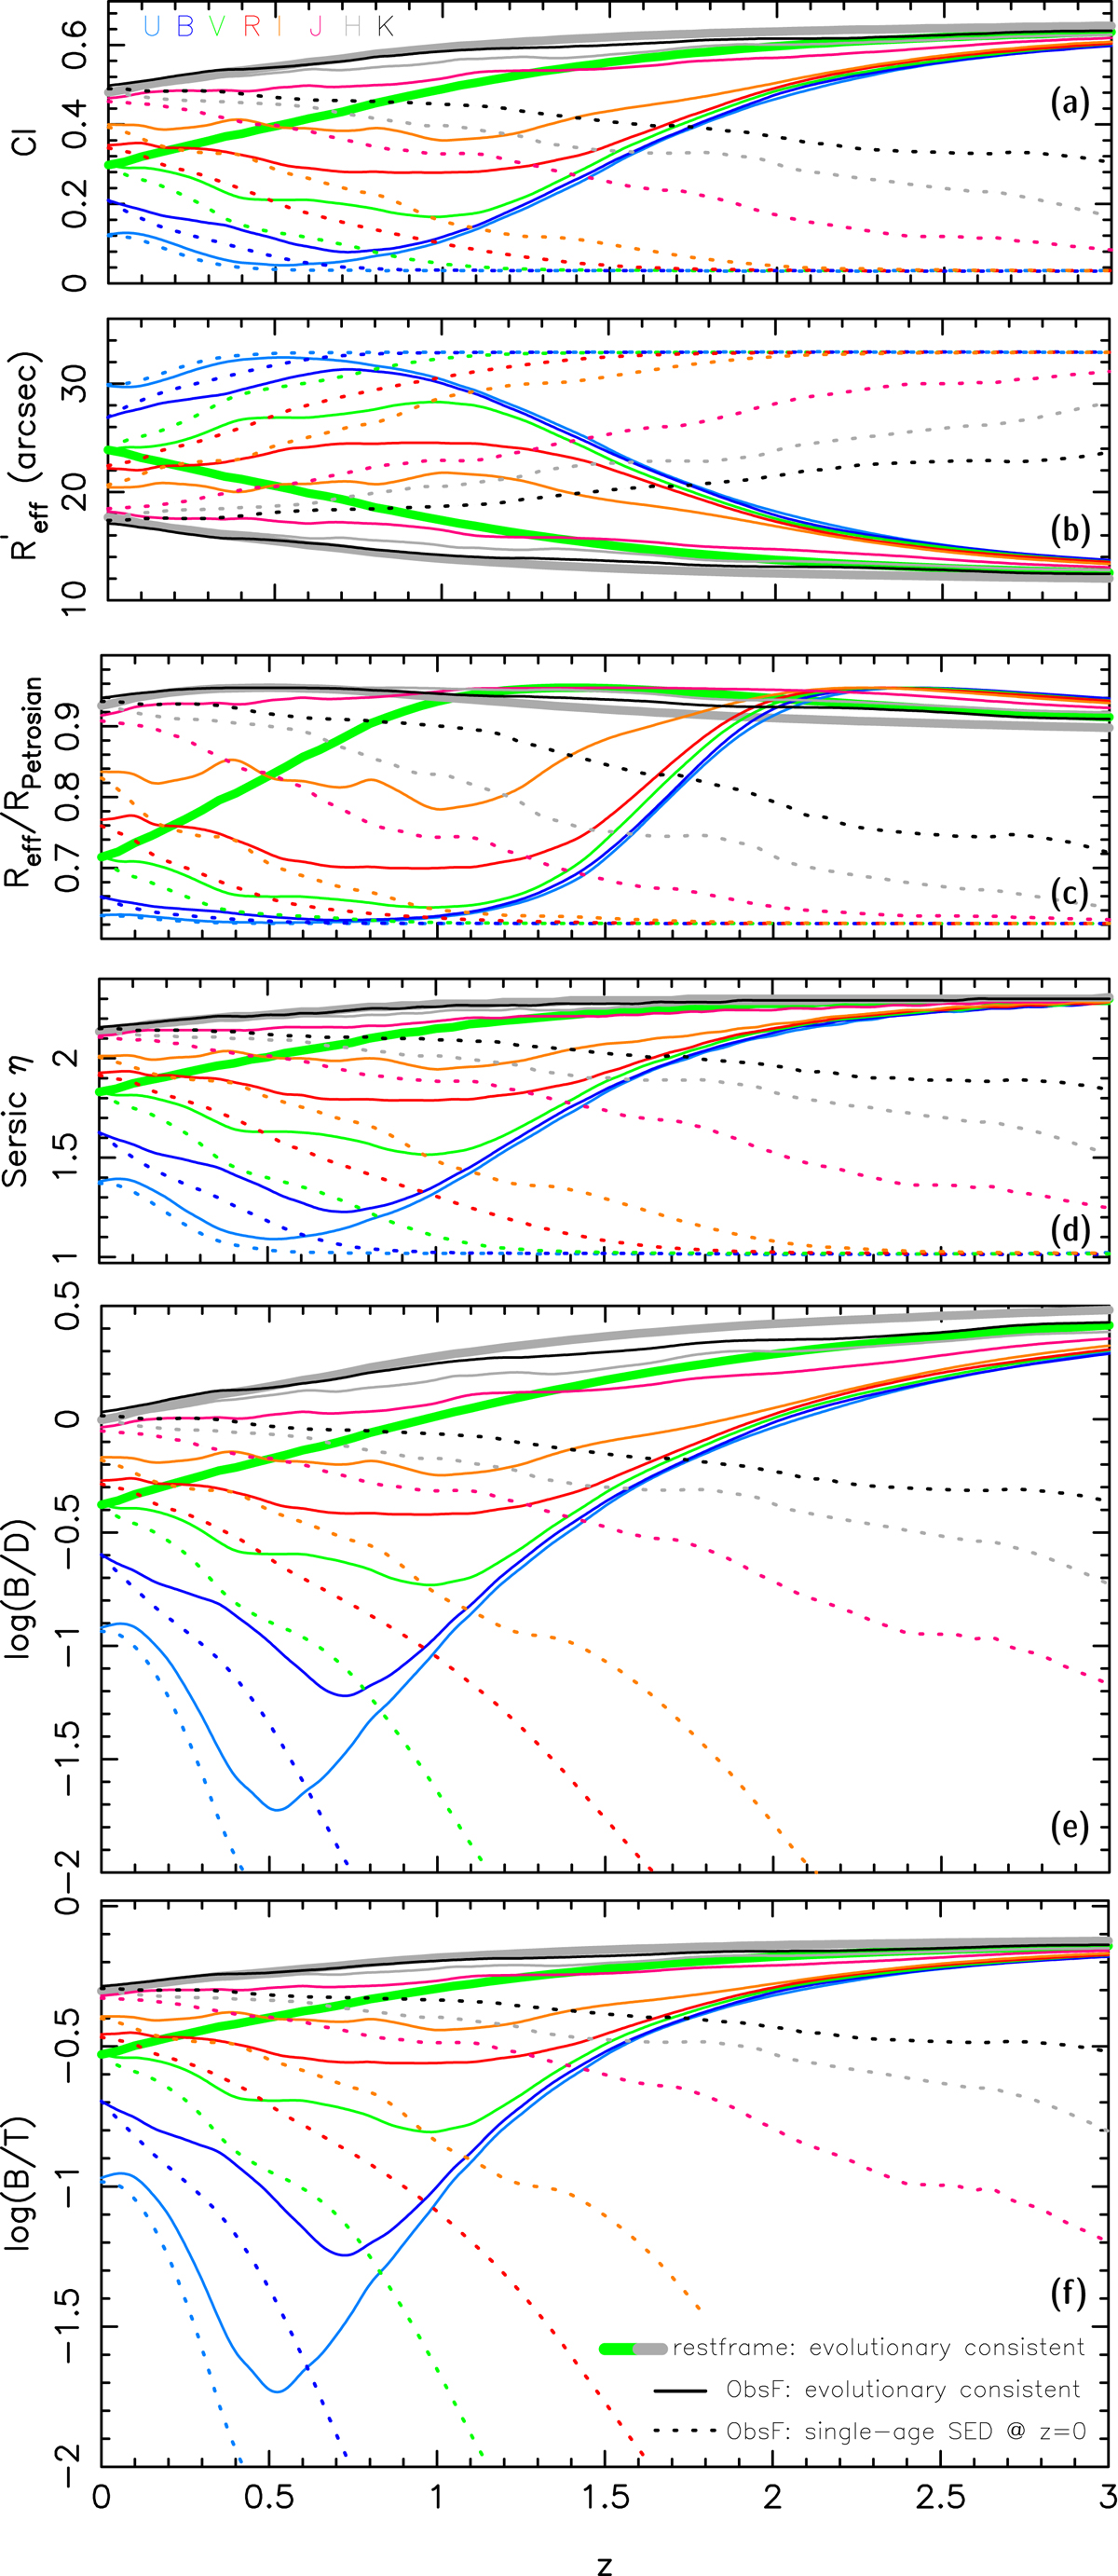
Photometric quantities obtained by simulating the cSED galaxy model in Fig. 7 in the redshift interval 0 ≤ z ≤ 3. Our synthetic galaxy consists of a bulge and a disk that have been forming for 13.7 Gyr according to, respectively, the τ1 and contSF SFH model. Single-age simulations based on the SED of a 13.7 Gyr old galaxy at z = 0 that is projected out to z = 3 are shown with dotted curves, whereas solid curves refer to EvCon simulations (Sect. 2.3). Thick curves show the true (rest-frame) values implied by EvCon models in V (green) and H (gray). a: concentration index after Eq. (1) ranging between 0 (pure disk) and > 0.54 (bulge-dominated galaxy). b: reduced effective radius (i.e., with the dependence of angular distance on z not taken into account). c: ratio between effective and Petrosian radius. d: Sérsic exponent, η. e and f: logarithm of the B/D and B/T luminosity ratios.
Current usage metrics show cumulative count of Article Views (full-text article views including HTML views, PDF and ePub downloads, according to the available data) and Abstracts Views on Vision4Press platform.
Data correspond to usage on the plateform after 2015. The current usage metrics is available 48-96 hours after online publication and is updated daily on week days.
Initial download of the metrics may take a while.