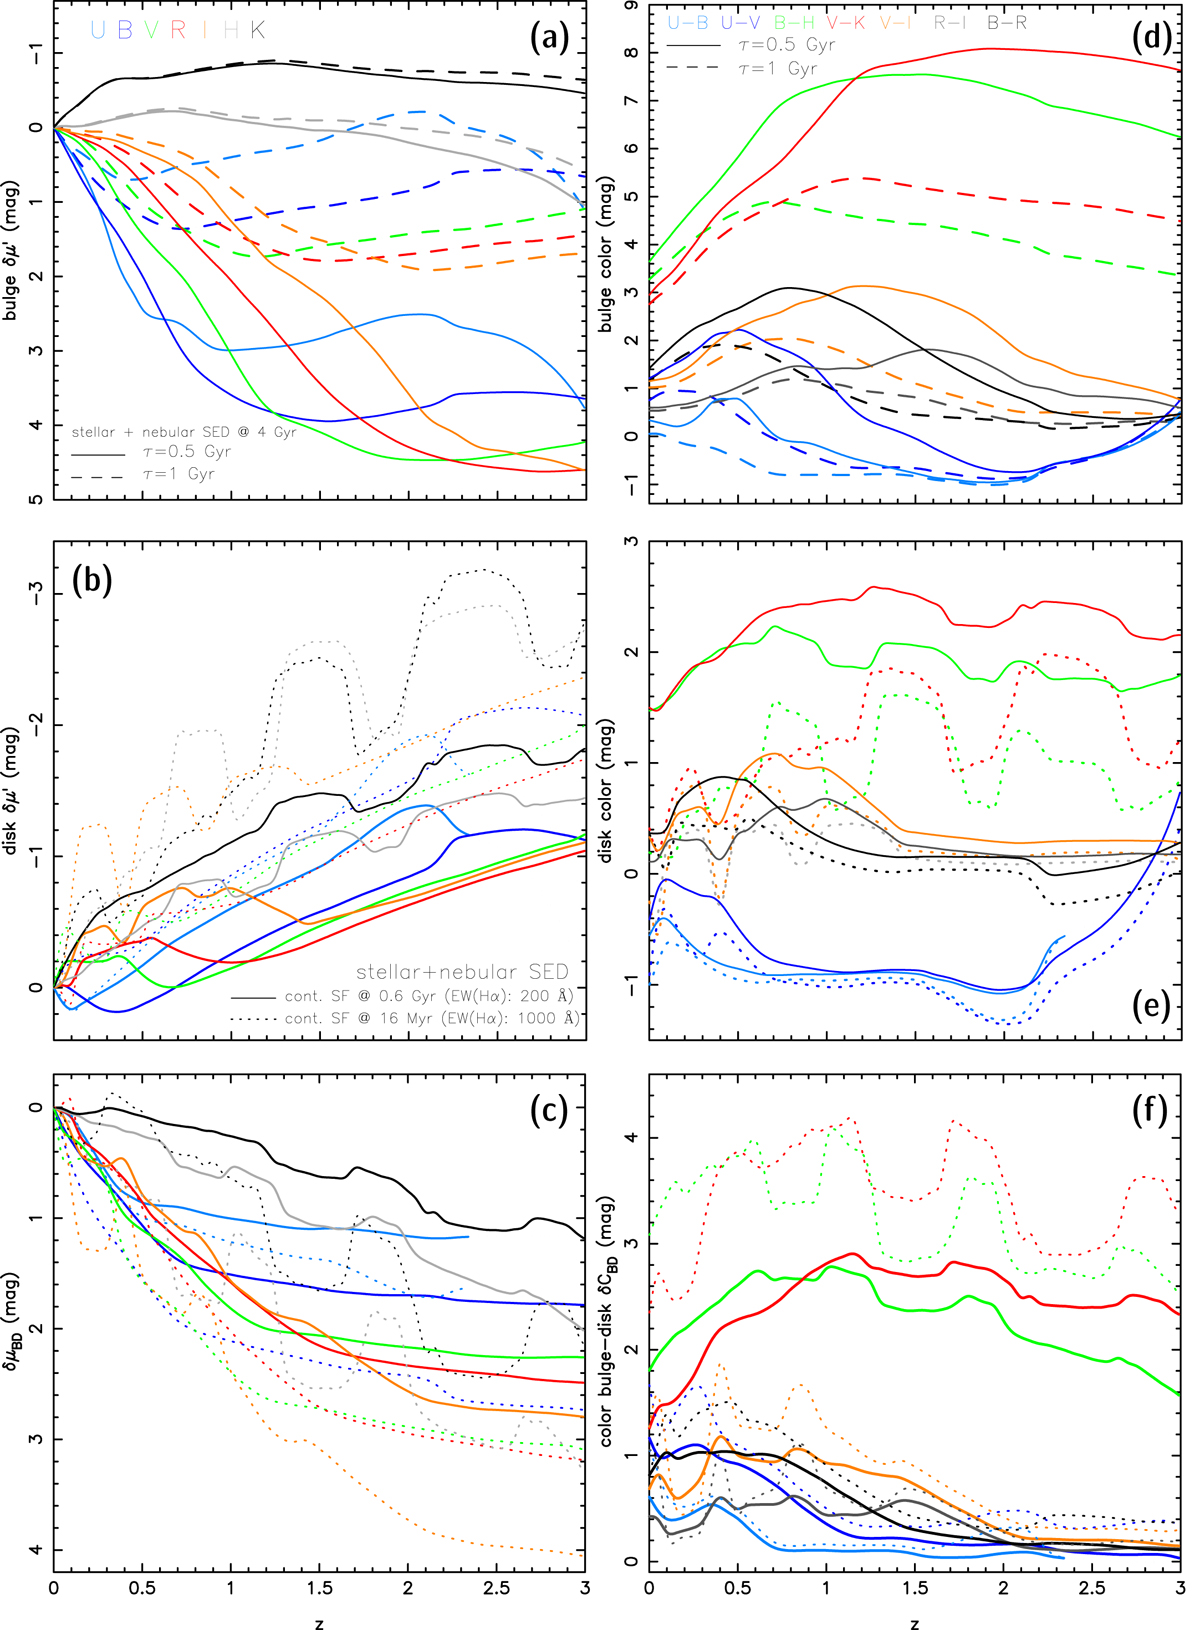
Fig. 4.
Download original image
Variation in δμ′ vs. z for simulations that include nebular (line and continuum) emission. As in Fig. 2g, the bulge (panel a) is approximated by a 4 Gyr old SED for a stellar population of solar metallicity that forms with an exponentially decreasing SFR with a τ of 0.5 and 1 Gyr (solid and dashed curve, respectively). As for the disk, we assume SEDs for a continuous SF scenario, one representing the case of moderately strong nebular emission (EW(Hα) ∼ 200 Å) in a 0.6 Gyr old stellar population of Z⊙/5 (solid curves) and the second one of very intense nebular emission (EW(Hα) ∼ 103 Å) excited by a 16 Myr old stellar population (dashed curve). These two cases are meant to approximate, respectively, intermediate and very early stages of the evolution of massive star-forming clumps emerging from VDIs (cf. the discussion in Papaderos et al. 2022) in high-z spiral galaxies (cf. Fig. 3). Whereas nebular emission has virtually no effect on the aging bulge, it strongly enhances the surface brightness of the disk at various broad redshift intervals where strong emission lines fall within various filter transmission curves. At z > 0.6 this effect is particularly strong in the NIR. Given the uncertain Lyα escape fraction, predictions in the U and B band should be considered only up to the redshift where the Lyα line (1216 Å) enters the blue edge of these filters (z ∼ 1.51 and ∼2.04, respectively). The layout is the same as in Fig. 2.
Current usage metrics show cumulative count of Article Views (full-text article views including HTML views, PDF and ePub downloads, according to the available data) and Abstracts Views on Vision4Press platform.
Data correspond to usage on the plateform after 2015. The current usage metrics is available 48-96 hours after online publication and is updated daily on week days.
Initial download of the metrics may take a while.