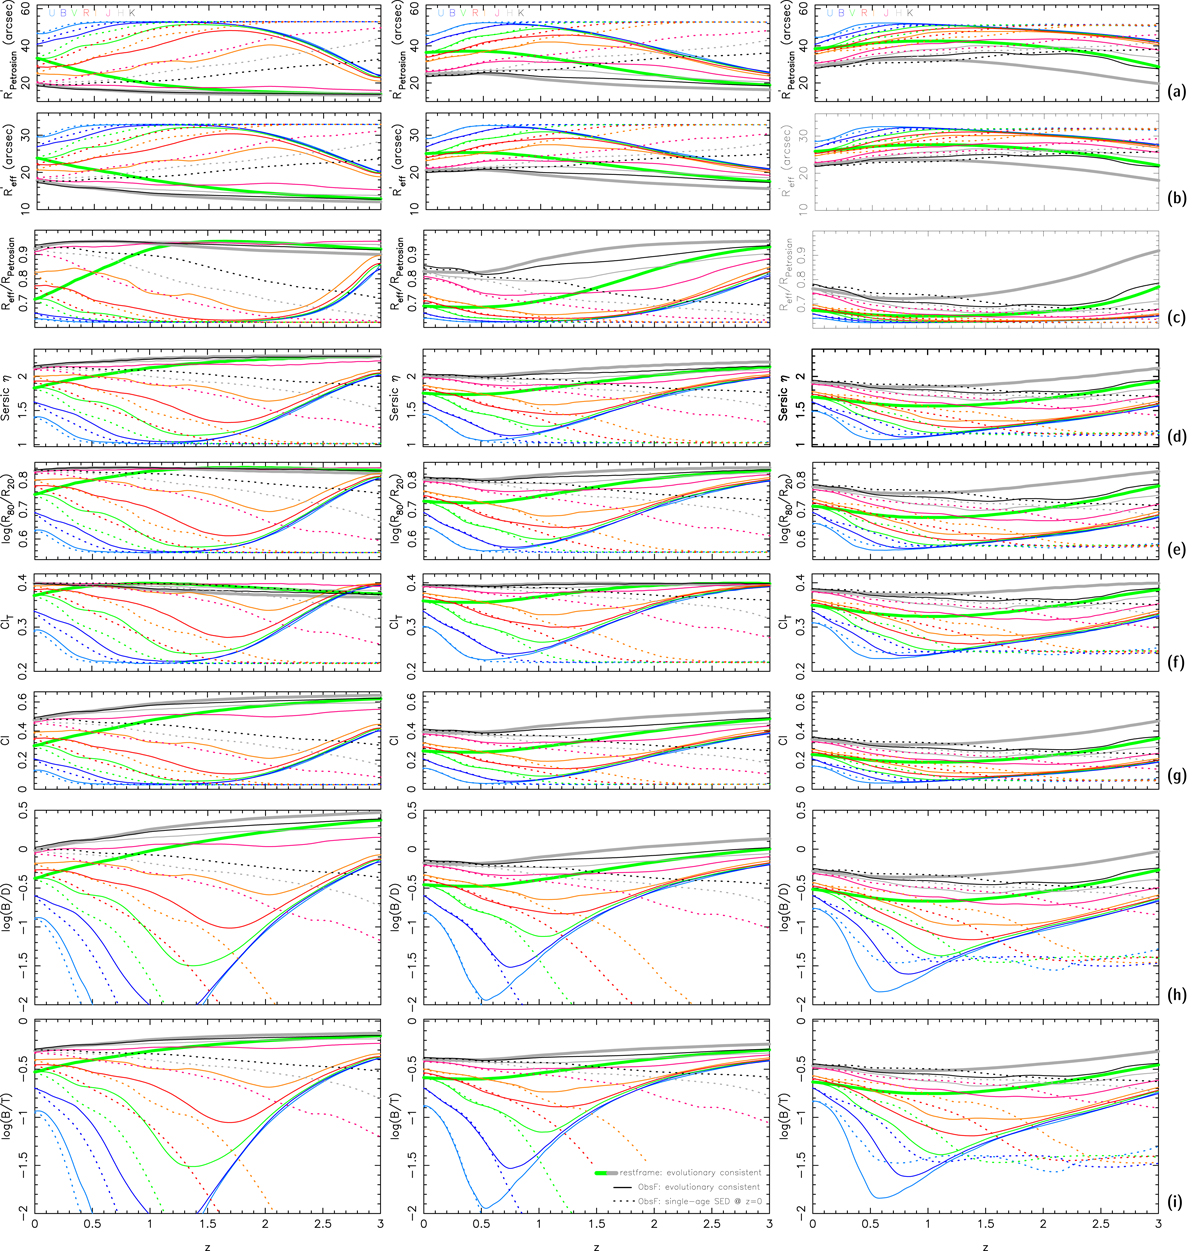
Fig. B.3.
Download original image
Photometric quantities for synthetic galaxies that consist of a bulge and a disk forming according to the τ0.5+contSF (left column), τ1+τ5 (middle column) and τ1+iB (right column) model (cf. Fig. A.1). Results from EvCon and single-age simulations are shown, respectively, with thin solid and dotted curves. Thick curves show rest-frame values in V (green) and H (gray), as obtained from EvCon models. Simulated galaxies in the first two columns comprise only stellar emission, whereas those in the right-hand column additionally include nebular emission.
Current usage metrics show cumulative count of Article Views (full-text article views including HTML views, PDF and ePub downloads, according to the available data) and Abstracts Views on Vision4Press platform.
Data correspond to usage on the plateform after 2015. The current usage metrics is available 48-96 hours after online publication and is updated daily on week days.
Initial download of the metrics may take a while.