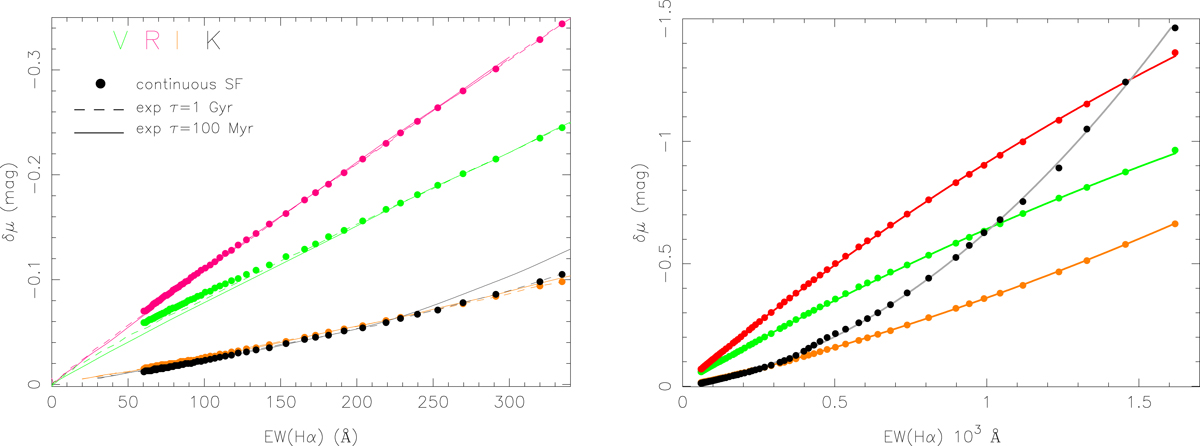
Fig. A.8.
Download original image
Enhancement δμ (mag) of broadband V, R, I and K magnitudes due to nebular (line and continuum) emission vs. EW(Hα) (Å). The left-hand panel shows a close-up view within 60≤EW(Hα) (Å)≤340 whereas determinations for an EW(Hα) of up to 1600 Å are shown in the right-hand panel. Symbols and lines in the left-hand panel have the same meaning as in Fig. A.7. Curves in the right-hand panel show polynomial fits in the range 60≤EW(Hα) (Å)≤1600 for predictions referring to continuous SF and a metallicity Z⊙/5 (cf. Table A.1).
Current usage metrics show cumulative count of Article Views (full-text article views including HTML views, PDF and ePub downloads, according to the available data) and Abstracts Views on Vision4Press platform.
Data correspond to usage on the plateform after 2015. The current usage metrics is available 48-96 hours after online publication and is updated daily on week days.
Initial download of the metrics may take a while.