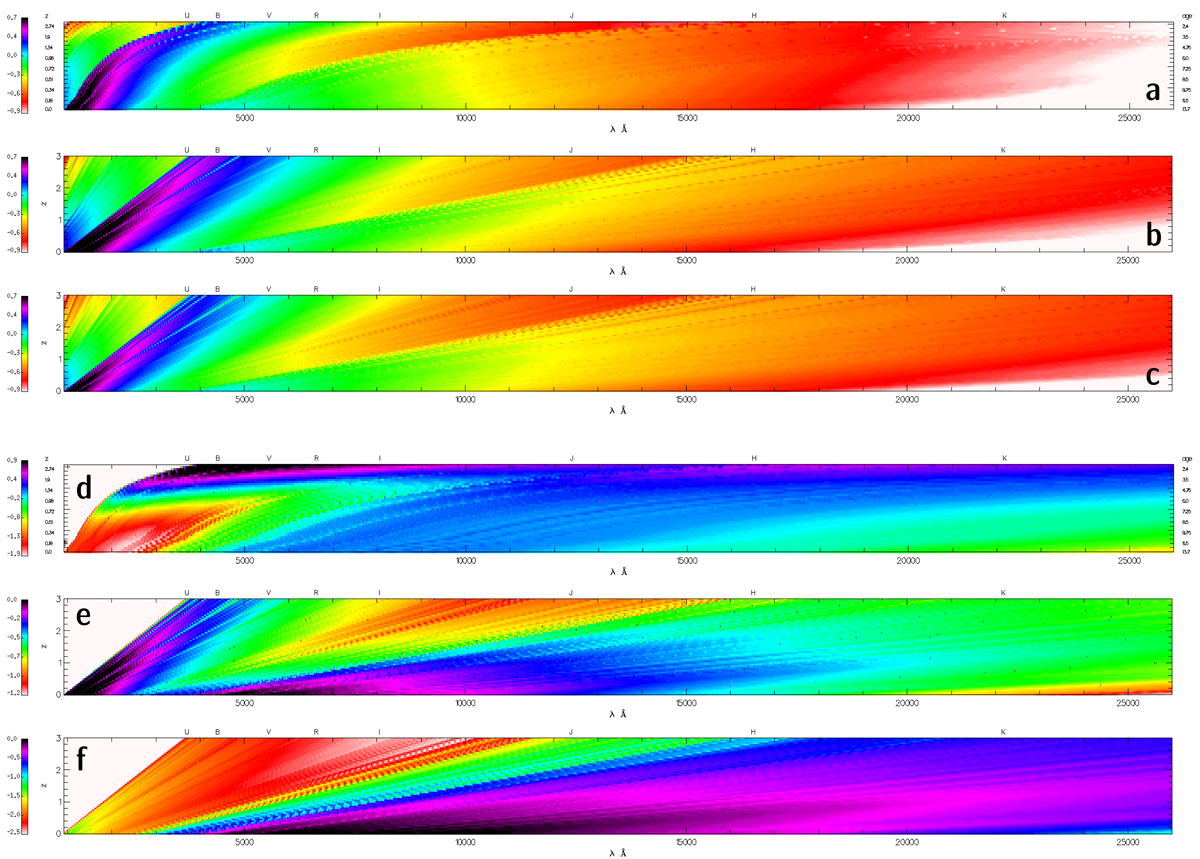
Fig. A.4.
Download original image
2D illustration of the difference between EvCon simulations and those based on single-age SED templates. All panels cover an observers-frame wavelength range from 912 Å to 2.6 μm for a redshift 0≤z≤3 (from bottom to top). The SEDs, displayed in a logarithmic representation, take only bandpass shift and wavelength stretching into account and are normalized to the flux density at ∼5500 Å of the SED at z = 0 (bottom line in each panel) to ease a comparison. Labels at the upper abscissa mark the central wavelength λc of the U, B, V, R, I, J, H, and K filters. a) EvCon simulation that uses a grid of (42) purely stellar SEDs covering an age between 2.2 Gyr (z = 3; upper row) and 13.7 Gyr (z = 0; lower row) for the contSF model and a stellar metallicity of Z⊙/5. b) Simulation based on a 4 Gyr old SED that is simulated out to z = 3 in increments of 0.05. c) As in panel b for a SED corresponding to an age of 13.7 Gyr. Panels d-f follow the same layout yet refer to an exponentially decreasing SFR with an e-folding time τ = 1 Gyr that started 13.7 Gyr ago and additionally include nebular emission. The blank area at the upper-left is due to the reprocessing of the LyC radiation (< 912 Å) into nebular and dust emission.
Current usage metrics show cumulative count of Article Views (full-text article views including HTML views, PDF and ePub downloads, according to the available data) and Abstracts Views on Vision4Press platform.
Data correspond to usage on the plateform after 2015. The current usage metrics is available 48-96 hours after online publication and is updated daily on week days.
Initial download of the metrics may take a while.