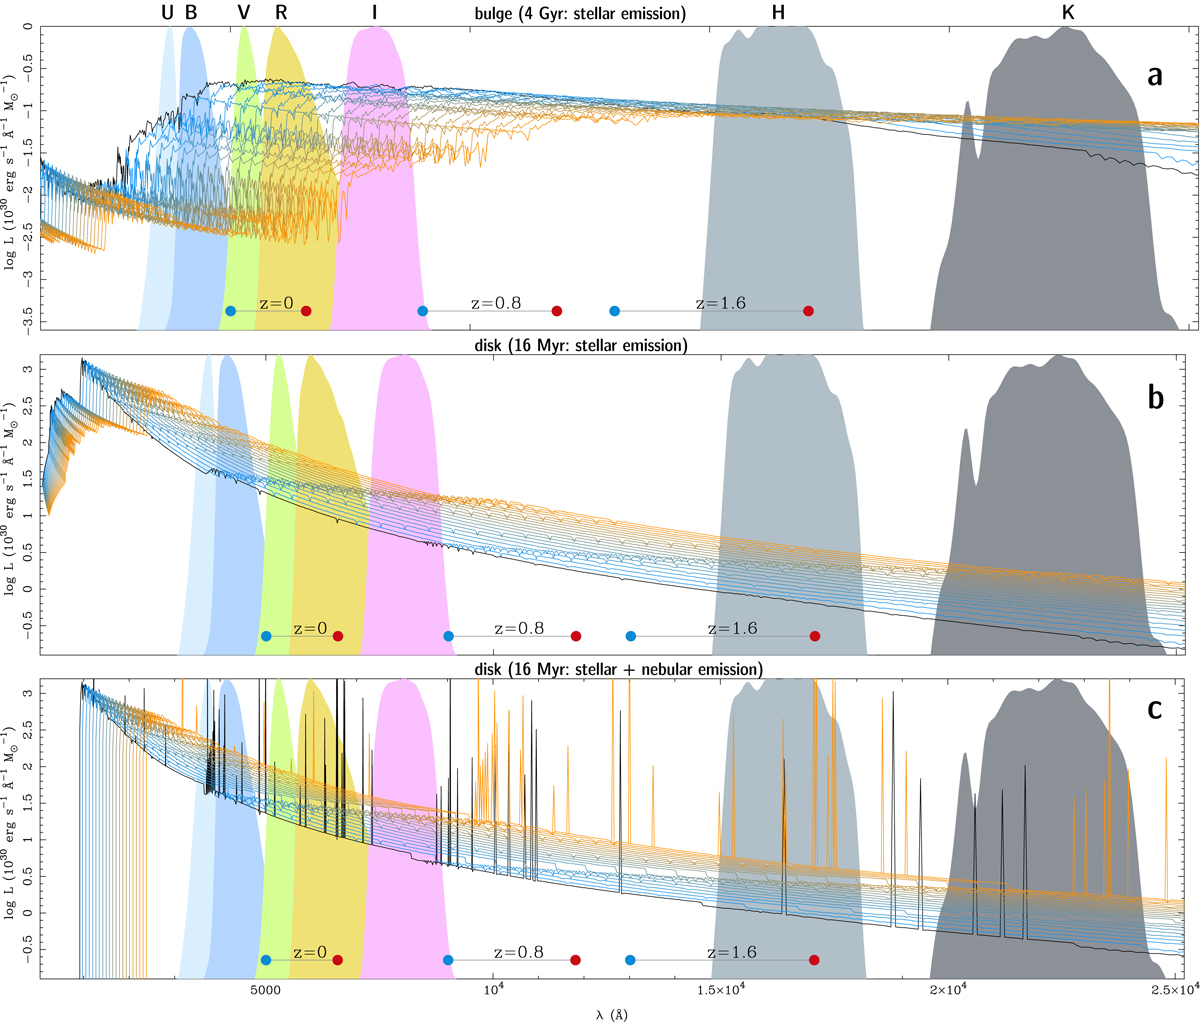
Fig. A.2.
Download original image
Illustration of the effect of bandpass shift and wavelength stretching on the example of SEDs approximating the bulge (panel a) and the disk (panels b and c) that are simulated from z = 0 (black) to z = 1.6 (dark orange). Shaded areas show normalized transmission curves of the U, B, V, Cousins R and I and the NIR H and K filters. Horizontal bars mark the wavelength separation between the [O III]5007 and Hα emission lines (blue and red dot, respectively) at a redshift of 0, 0.8 and 1.6. The SEDs, computed with PéGASE 2, refer to 1 M⊙ and a Salpeter IMF between 0.1 and 100 M⊙. a) Stellar SED for a 4 Gyr old stellar population that forms with an exponentially decreasing SFR with an e-folding time of 0.5 Gyr (τ0.5 model). It can be seen that, whereas the emission registered in the K filter increases with increasing z, the ObsF emission in U through R decreases by more than 1 dex (cf. Fig. 2g). b) Stellar SED for a 16 Myr old stellar population of Z⊙/5 forming at a constant SFR (contSF model). c) As in panel b, however, with the contSF model including both stellar and nebular emission. The drop of the SED shortward of 912 Å is because of the reprocessing of the ionizing LyC radiation into nebular and dust emission (see Fioc & Rocca-Volmerange 1997, for details). For the sake of better readability, emission lines are shown only for the SED at z = 0 and z = 1.6.
Current usage metrics show cumulative count of Article Views (full-text article views including HTML views, PDF and ePub downloads, according to the available data) and Abstracts Views on Vision4Press platform.
Data correspond to usage on the plateform after 2015. The current usage metrics is available 48-96 hours after online publication and is updated daily on week days.
Initial download of the metrics may take a while.