Fig. 18.
Download original image
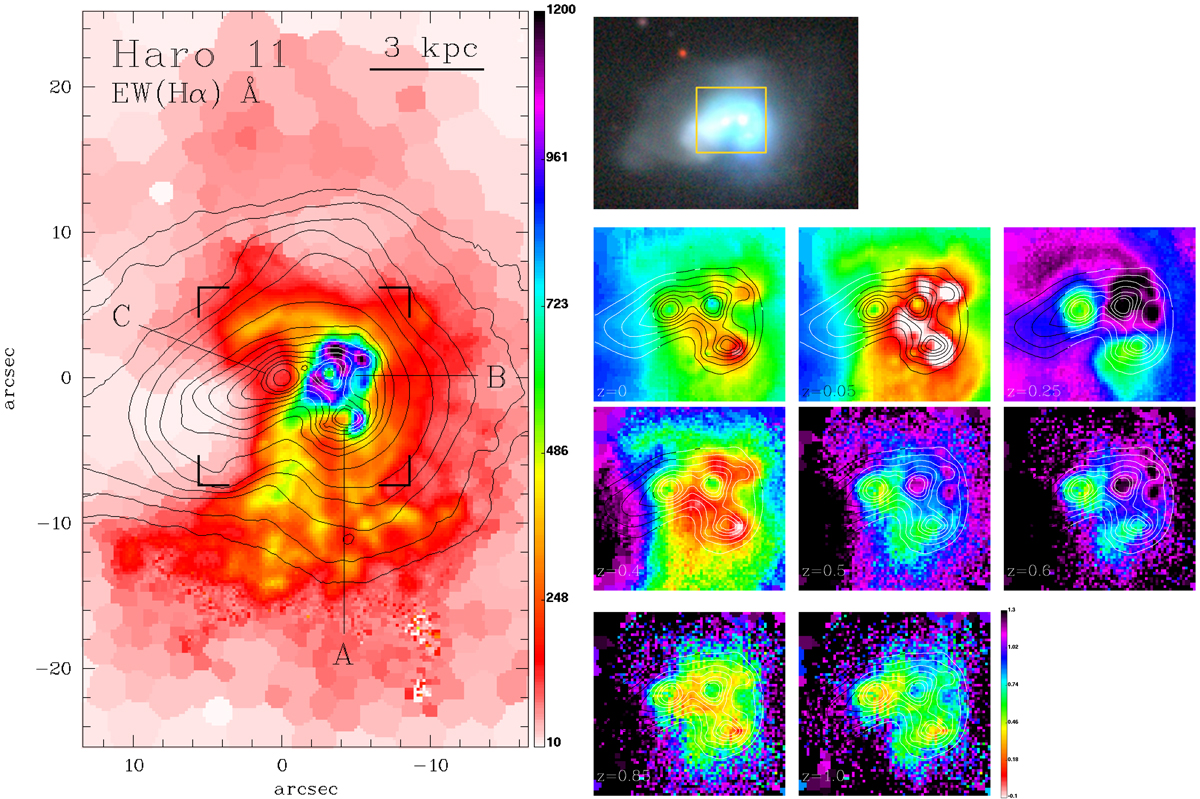
Illustration of the impact of CMOD on color maps of higher-z starburst galaxies with their typically extremely intense and spatially inhomogeneous nebular emission. Left: EW(Hα) map of the nearby (D = 82 Mpc) BCD galaxy Haro 11 (Bergvall & Olofsson 1986), computed from archival MUSE data with PORTO3D and displayed between 10 and 1200 Å. The three dominant stellar knots (A–C) are indicated, and contours delineate the morphology of the emission-line-free continuum between 6390 Å and 6490 Å. It can be seen that nebular emission has its peak in the western half of the galaxy, where the EW(Hα) locally exceeds 1200 Å, in agreement with the morphological evidence from HST imaging (e.g., Sirressi et al. 2022). Top-right: true-color image of Haro 11 from DECaLS. The overlaid rectangle (![]() ) corresponds to the region marked on the EW(Hα) map. Bottom-right: simulated V − I color maps within the rectangular region marked in the EW(Hα) image, computed from spectral synthesis models (cf. Sect. 4) for z = 0, 0.05, 0.25, 0.4, 0.5, 0.6, 0.85 and 1. The color maps are displayed in the range between −0.1 mag and 1.3 mag. Contours go from 17 to 20 I mag/▫″ (in the rest frame) in increments of 0.5 mag. It can be appreciated that the 2D color patterns of a starburst galaxy like Haro 11 depend on redshift, as the rest-frame UV SED of its individual stellar populations varies with their age and metallicity, and spatially inhomogeneous nebular contamination can be extremely important.
) corresponds to the region marked on the EW(Hα) map. Bottom-right: simulated V − I color maps within the rectangular region marked in the EW(Hα) image, computed from spectral synthesis models (cf. Sect. 4) for z = 0, 0.05, 0.25, 0.4, 0.5, 0.6, 0.85 and 1. The color maps are displayed in the range between −0.1 mag and 1.3 mag. Contours go from 17 to 20 I mag/▫″ (in the rest frame) in increments of 0.5 mag. It can be appreciated that the 2D color patterns of a starburst galaxy like Haro 11 depend on redshift, as the rest-frame UV SED of its individual stellar populations varies with their age and metallicity, and spatially inhomogeneous nebular contamination can be extremely important.
Current usage metrics show cumulative count of Article Views (full-text article views including HTML views, PDF and ePub downloads, according to the available data) and Abstracts Views on Vision4Press platform.
Data correspond to usage on the plateform after 2015. The current usage metrics is available 48-96 hours after online publication and is updated daily on week days.
Initial download of the metrics may take a while.