Fig. 16.
Download original image
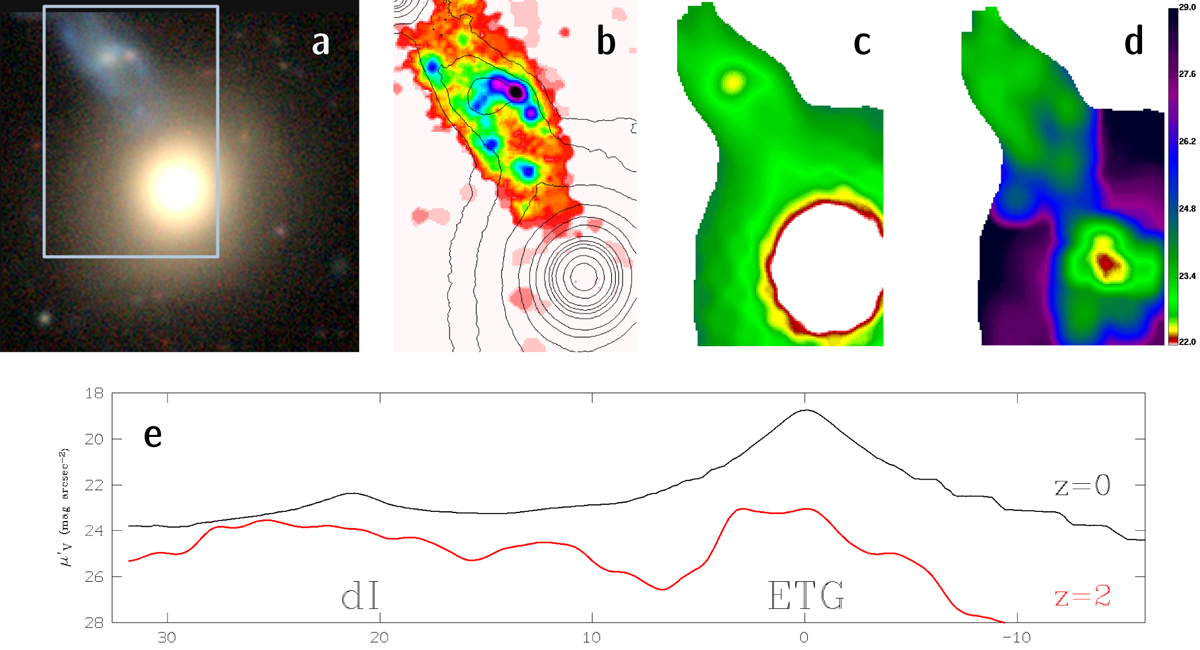
Illustration of the impact of CMOD on the morphology of higher-z galaxies. a: true-color composite image of Mrk 1172 (D = 172.2 Mpc) from the Dark Energy Camera Legacy Survey (DECaLS; Dey et al. 2019), combining exposures in the g, r and z filters. b: Hα map of the galaxy obtained with PORTO3D from archival MUSE data within the rectangular area in panel a. The ETG is devoid of nebular emission, contrary to the faint dI NE of it (cf. Lassen et al. 2021), c and d: V′ images simulated for z = 0 and z = 2 following the procedure in Sect. 4 and displayed between 22 and 29 mag/▫″ (the saturated white area at the center of the ETG reaches a μV ∼ 18.6 mag/▫″), e: V′ surface brightness within a 3″-wide pseudo-slit crossing the center of the ETG and the dI at a position angle of 28°. The reduced surface brightness of the ETG at z = 2 (red curve) is by ∼4.4 mag fainter than its true (rest-frame) value, whereas the dI only suffers a modest dimming by 1.5 mag. Thus, although the rest-frame central V surface brightness of the ETG is by 3.7 mag higher than that of the dI, both galaxies appear almost equally bright at z = 2.
Current usage metrics show cumulative count of Article Views (full-text article views including HTML views, PDF and ePub downloads, according to the available data) and Abstracts Views on Vision4Press platform.
Data correspond to usage on the plateform after 2015. The current usage metrics is available 48-96 hours after online publication and is updated daily on week days.
Initial download of the metrics may take a while.