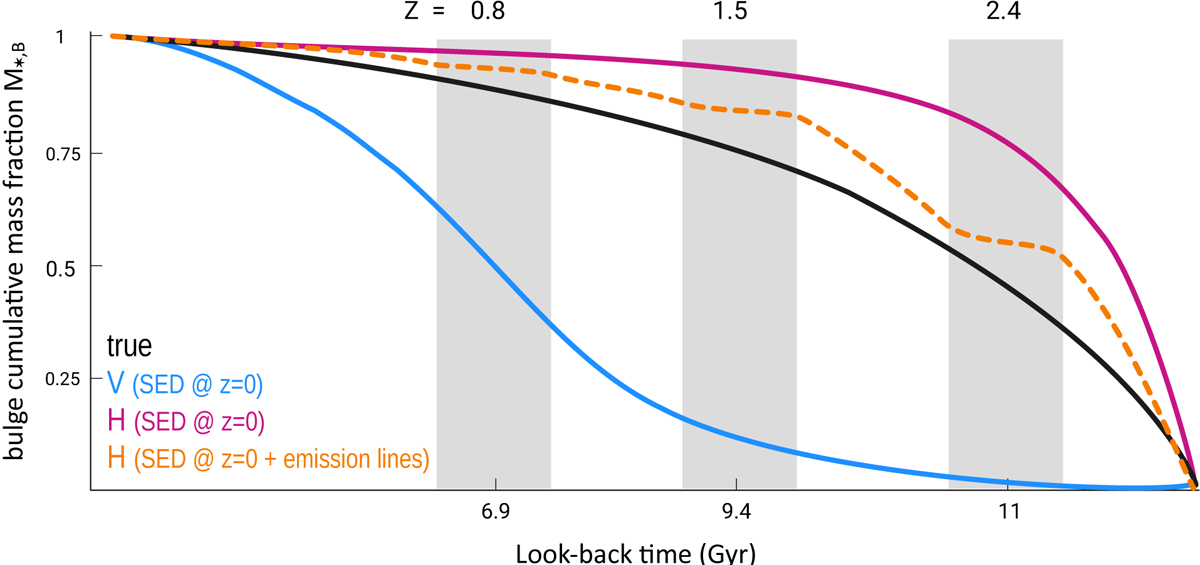
Fig. 14.
Download original image
Schematic view of the expected effect of CMOD on photometric determinations of the stellar mass of the bulge M⋆, B. The black curve shows the cumulative fraction of M⋆, B as a function of lookback time, whereas solid blue and magenta curves the values expected from image decomposition in the V and H band for purely stellar galaxy models (cf. Fig. 2). The orange-dashed curve qualitatively delineates the additional effect that massive SF clumps forming out of VDIs could have on M⋆, B determinations: in redshift intervals where strong emission lines fall within the H filter transmission curve (e.g., at z = 1.5 in the case of Hα+[N II]; gray-shaded areas) the surface brightness in the disk periphery is differentially enhanced relative to that in the SF-quenched galaxy center. One consequence of this is the over-subtraction of the disk from the galaxy, leading to the under-estimation of the net luminosity (and M⋆, B) of the bulge (P22). This would translate to a flattening of the M⋆, B growth curve in discrete z intervals, possibly prompting the conclusion that bulge formation proceeds in major waves (cf. Sect. 2.2 and Fig. A.8).
Current usage metrics show cumulative count of Article Views (full-text article views including HTML views, PDF and ePub downloads, according to the available data) and Abstracts Views on Vision4Press platform.
Data correspond to usage on the plateform after 2015. The current usage metrics is available 48-96 hours after online publication and is updated daily on week days.
Initial download of the metrics may take a while.