Open Access
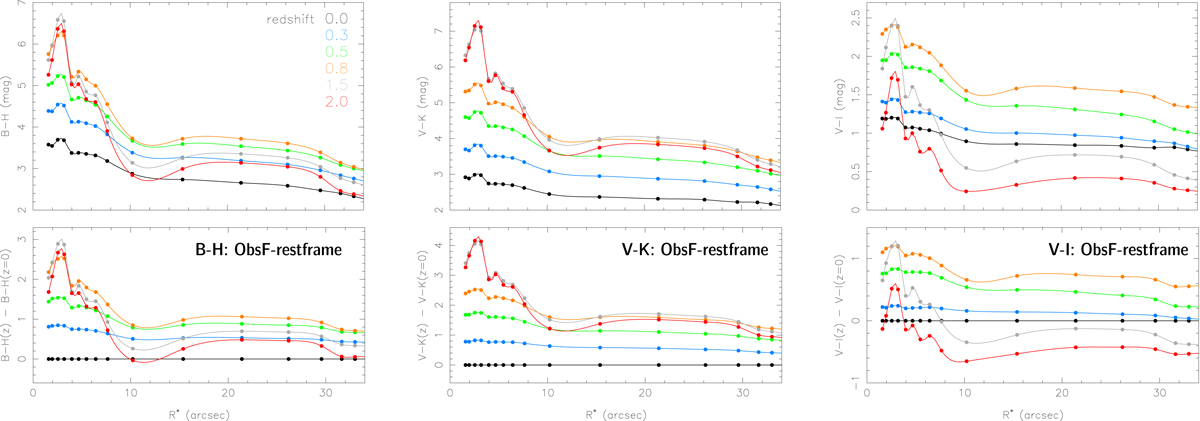
Fig. 12.
Download original image
B − H, V − K, and V − I color profiles of NGC 0309 at z = 0, 0.3, 0.5, 0.8, 1.5, and 2. The lower panels display the difference (in mag) relative to the true (rest-frame) color profiles of the galaxy. It can be seen that CMOD leads to a strong amplification of negative color gradients within the passively evolving bulge.
Current usage metrics show cumulative count of Article Views (full-text article views including HTML views, PDF and ePub downloads, according to the available data) and Abstracts Views on Vision4Press platform.
Data correspond to usage on the plateform after 2015. The current usage metrics is available 48-96 hours after online publication and is updated daily on week days.
Initial download of the metrics may take a while.