Fig. 1.
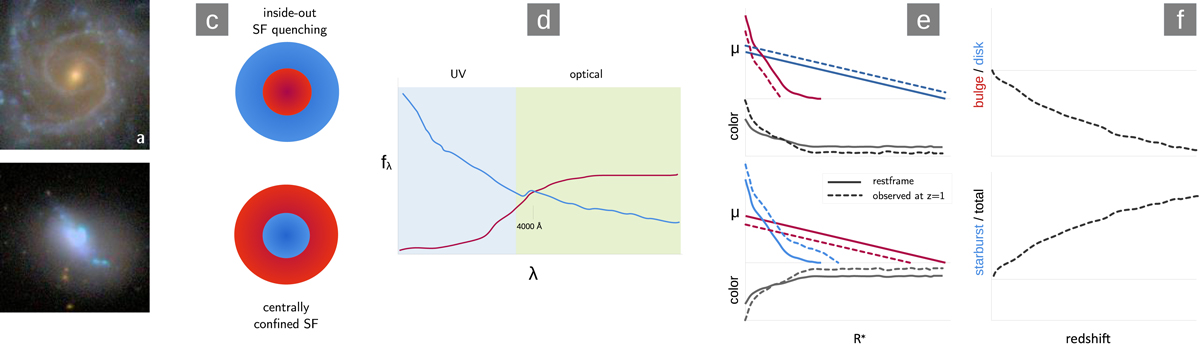
Download original image
Schematic illustration of the expected change of the structural properties of local cSED galaxies when shifted to z ∼ 1. The two main types of cSED galaxies are shown with SDSS images in panels a and b: The case of a centrally SF-quenched spiral galaxy is exemplified by NGC 309 (Breda & Papaderos 2023), whereas Haro 3 is a typical BCD galaxy (Loose & Thuan 1986; Kunth et al. 1988) with intense SF activity in the central part of an underlying old stellar host. These two main types of cSED galaxies are sketched in panel c with the SF-quenched and star-forming zones of the galaxy depicted in red and blue, respectively. Panel d delineates the rest-frame optical-to-UV SED of these two zones, with the vertical line marking the 4000 Å break. Panel e attempts a qualitative description of the change in the V-band SBP μV (mag/▫″) and V − I (mag) color profile when a local cSED galaxy is artificially redshifted to z ∼ 1 such that the rest-frame NUV emission moves into the V band. Cosmological surface brightness dimming is ignored for the sake of better visibility and because it is canceled out in color profiles. Rest-frame and ObsF profiles are shown with solid and dashed curves, respectively. In the case of a cSED galaxy such as NGC 309, the SF-quenched bulge experiences a dimming, whereas the opposite is the case for the surrounding star-forming disk. This results in a systematically underestimated B/D ratio and in an amplified bulge-to-disk color contrast with increasing z, and thus also in a steepening of the radial color gradient within the bulge (upper diagram in panels e and f). The opposite is the case in a cSED galaxy with a central starburst, such as Haro 3: in this case, the strong UV emission of the star-forming component leads to a surface brightness enhancement of the ObsF V-band emission simultaneously with a dimming of the surrounding older stellar host, and hence to an increasing starburst-to-total luminosity ratio (lower diagram in panel f). Similar yet reverse to the situation before, radial color gradients are amplified.
Current usage metrics show cumulative count of Article Views (full-text article views including HTML views, PDF and ePub downloads, according to the available data) and Abstracts Views on Vision4Press platform.
Data correspond to usage on the plateform after 2015. The current usage metrics is available 48-96 hours after online publication and is updated daily on week days.
Initial download of the metrics may take a while.