Open Access
Fig. 9.
Download original image
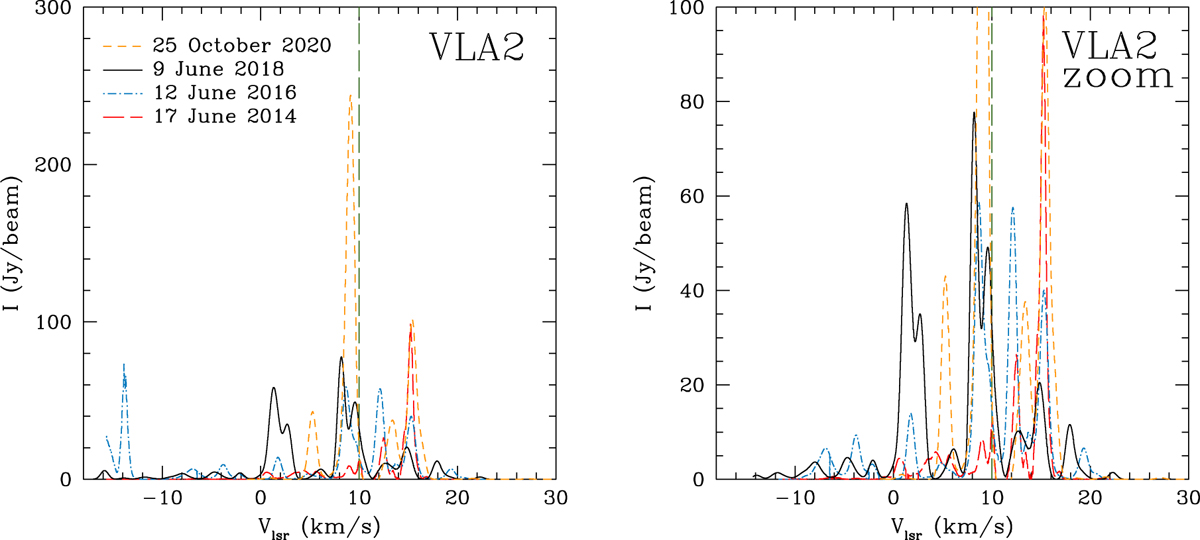
Comparison of the total sum of the H2O maser spectra detected toward VLA 2 with the EVN in epochs 2014.46, 2016.45, 2018.44, and 2020.82. The vertical dashed dark-green line indicates the assumed systemic velocity of the region (Vlsr = +10.0 km s−1; Shepherd et al. 2003).
Current usage metrics show cumulative count of Article Views (full-text article views including HTML views, PDF and ePub downloads, according to the available data) and Abstracts Views on Vision4Press platform.
Data correspond to usage on the plateform after 2015. The current usage metrics is available 48-96 hours after online publication and is updated daily on week days.
Initial download of the metrics may take a while.