Fig. 4.
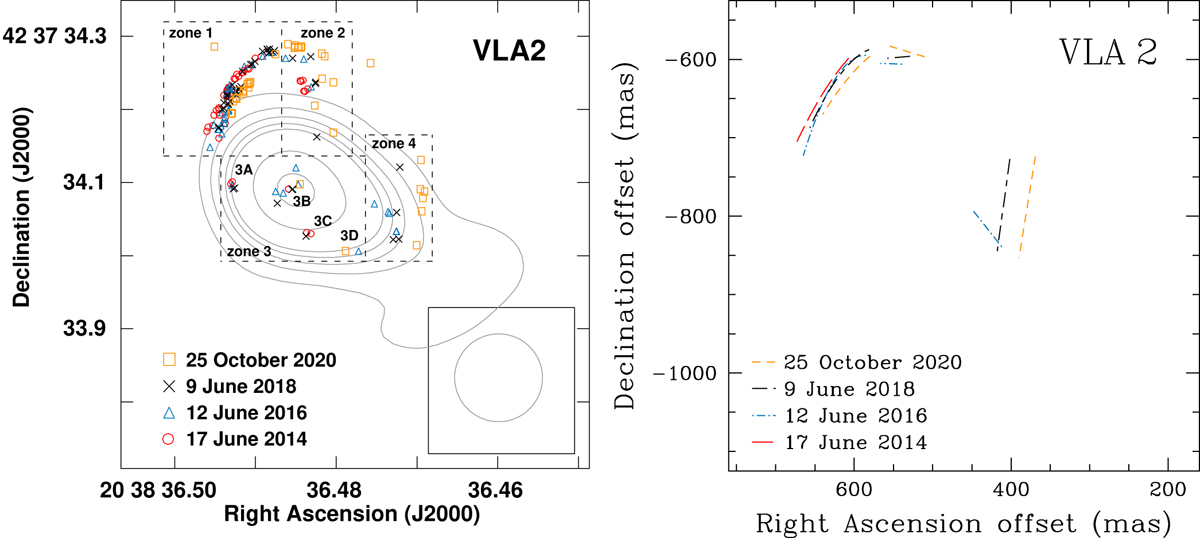
Download original image
Comparison of the H2O maser features detected toward VLA 2 (left panel) in the four EVN epochs (2014.46, 2016.45, 2018.44, and 2020.82) and superimposed to the natural-weighted continuum map at K-band (central frequency 22 GHz) of the thermal, collimated ionized wind emitted by VLA 2 obtained with the VLA by Carrasco-González et al. (2015). The light gray contours are 5, 10, 15, 20, 25, 50, and 75 times σ = 10 μJy beam−1 and the VLA beam is shown on the bottom right corner. The positions of the maser features are corrected assuming the proper motion of the subregion W75N(B) equal to the median proper motion measured for the 6.7 GHz CH3OH maser features by Rygl et al. (2012), ⟨μα⟩ = (−1.97 ± 0.10) mas yr−1 and ⟨μδ⟩ = (−4.16 ± 0.15) mas yr−1. The size of the symbols are ten times the uncertainties of the absolute positions of the maser features (see Table 2). For clarity, we show the parabolic fit of the maser features of zone 1 and the linear fit of the maser features of zone 2 (north features) and zone 4 for each epoch (right panel). The reference position is α2000 = 20h38m36s.43399 and δ2000 = +42° 37′34.″8710. The parameters of the linear and parabolic fits are reported in Tables 4 and 5, respectively.
Current usage metrics show cumulative count of Article Views (full-text article views including HTML views, PDF and ePub downloads, according to the available data) and Abstracts Views on Vision4Press platform.
Data correspond to usage on the plateform after 2015. The current usage metrics is available 48-96 hours after online publication and is updated daily on week days.
Initial download of the metrics may take a while.