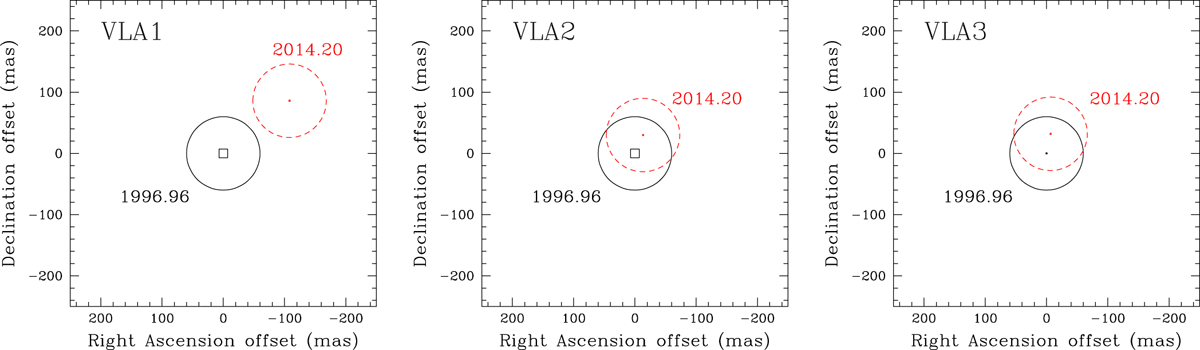
Fig. B.1.
Download original image
Comparison of the positions of the continuum emission at K-band of VLA 1 (left panel), VLA 2 (central panel), and VLA 3 (right panel) as observed in epoch 1996.96 (solid black; Torrelles et al. 1997) and epoch 2014.20 (dashed red; Carrasco-González et al. 2015; Rodríguez-Kamenetzky et al. 2020). The squares represent the uncertainties of the peaks positions (see Table B.1) and the circles are the restoring circular beam of 0.″12 used to properly compare the two epochs. Each panel is centered at the corresponding position of the YSO in epoch 1996.96 (see Table B.1). The positions of epoch 2014.20 are corrected for the proper motion of the region W75N(B) as measured by Rygl et al. (2012), ⟨μα⟩ = (−1.97 ± 0.10) mas yr−1 and ⟨μδ⟩ = (−4.16 ± 0.15) mas yr−1.
Current usage metrics show cumulative count of Article Views (full-text article views including HTML views, PDF and ePub downloads, according to the available data) and Abstracts Views on Vision4Press platform.
Data correspond to usage on the plateform after 2015. The current usage metrics is available 48-96 hours after online publication and is updated daily on week days.
Initial download of the metrics may take a while.