Fig. A.1.
Download original image
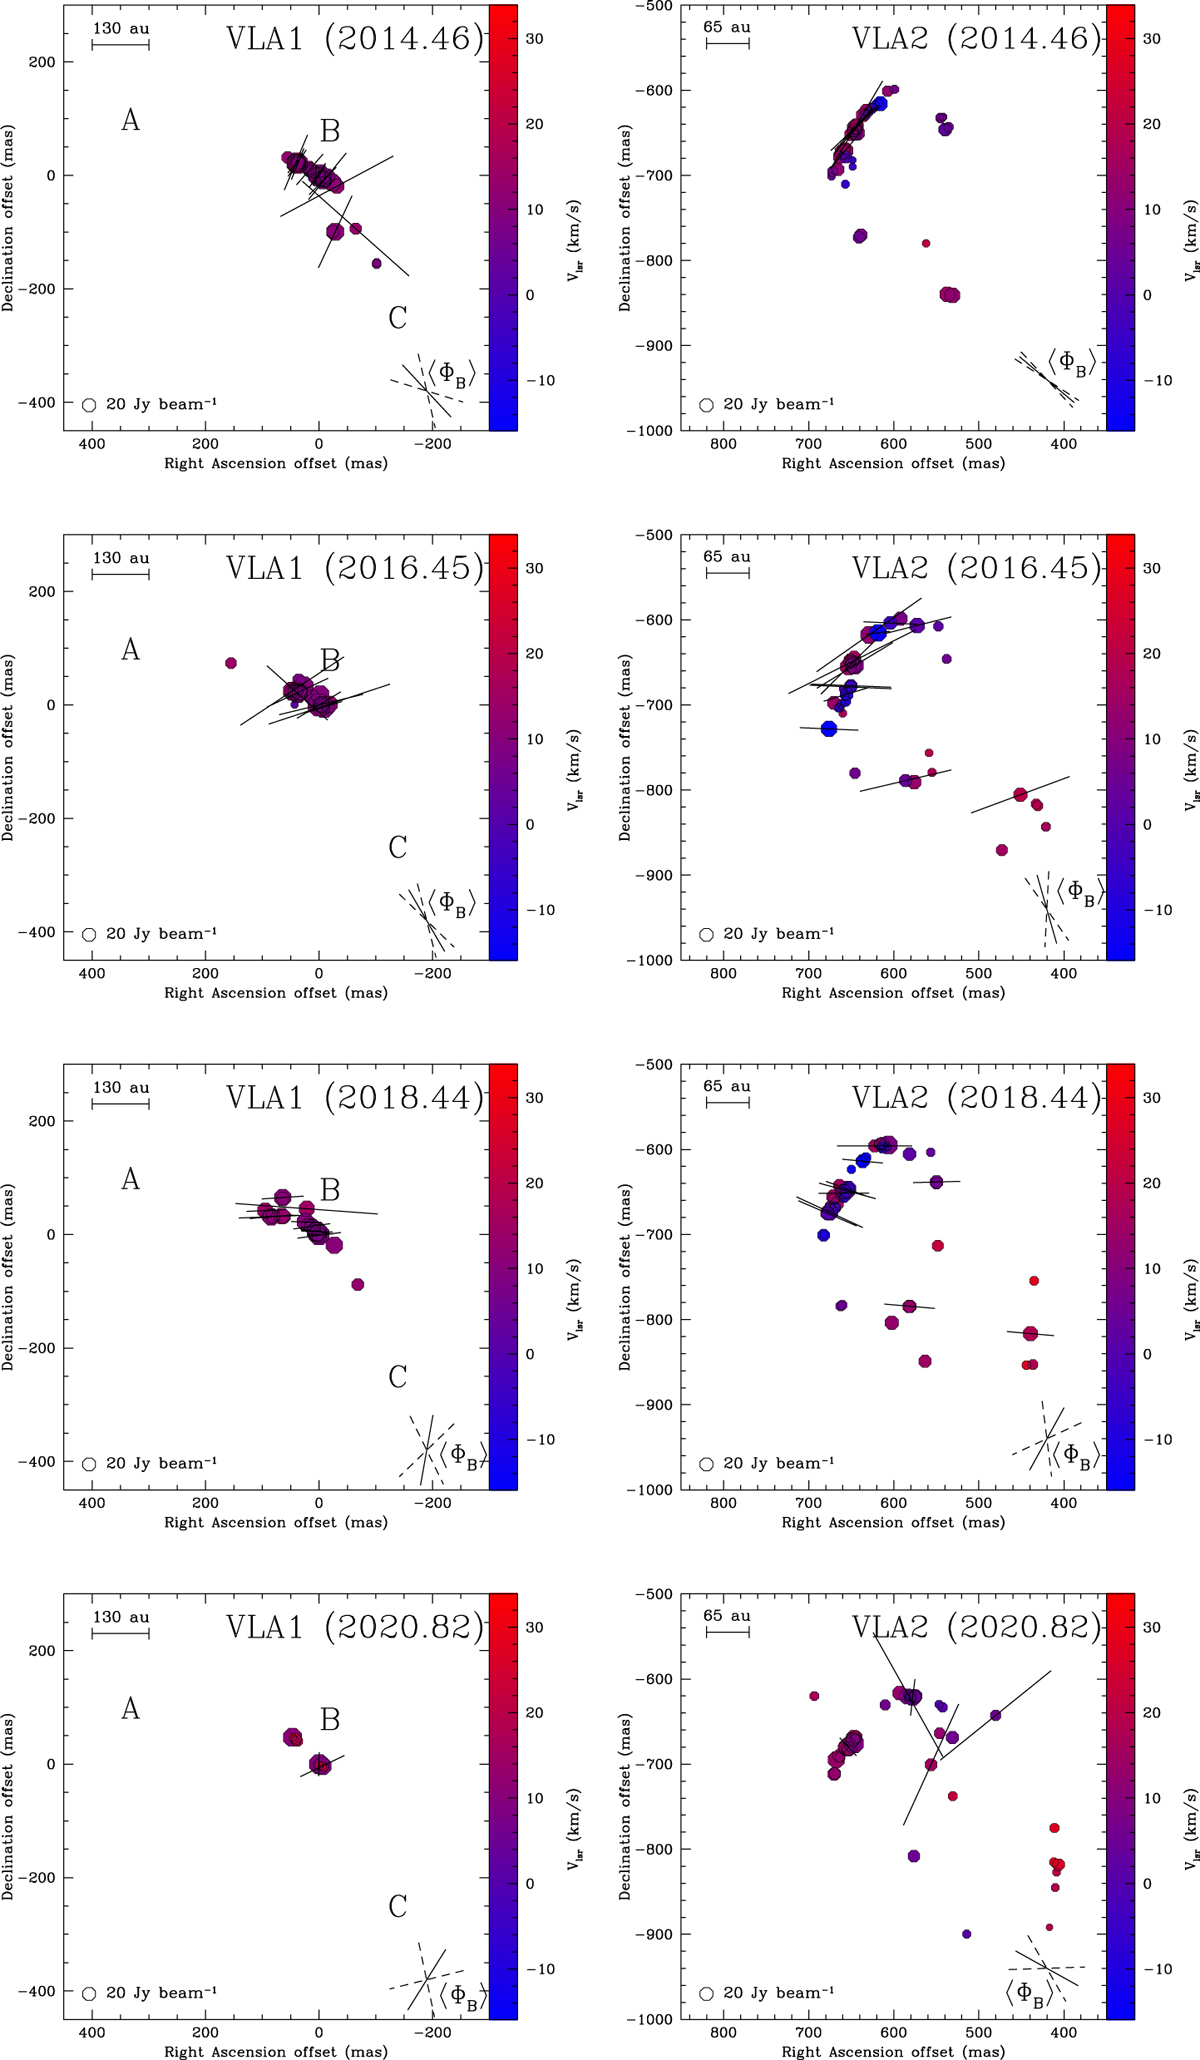
Close-up view of the 22 GHz H2O maser features detected around the radio sources VLA 1 (left panels) and VLA 2 (right panels) in epochs 2014.46 (top panels), 2016.45, 2018.44, and 2020.82 (bottom panels). The reference positions are reported in Table 2. The letters A, B, and C indicate the position of the three maser groups identified around VLA 1 by S11a and they are reported here only for reference. The octagonal symbols are the identified maser features scaled logarithmically according to their peak intensity (Tables A.1-A.8). Maser LSR radial velocities are indicated by color (the assumed systemic velocity of the region is Vlsr = +10.0 km s−1; Shepherd et al. 2003). The linear polarization vectors, scaled logarithmically according to the polarization fraction Pl, are overplotted. In the bottom-right corner of all panels the error-weighted orientation of the magnetic field (⟨ΦB⟩) is also reported; the two dashed segments indicate the uncertainties.
Current usage metrics show cumulative count of Article Views (full-text article views including HTML views, PDF and ePub downloads, according to the available data) and Abstracts Views on Vision4Press platform.
Data correspond to usage on the plateform after 2015. The current usage metrics is available 48-96 hours after online publication and is updated daily on week days.
Initial download of the metrics may take a while.