Fig. 12.
Download original image
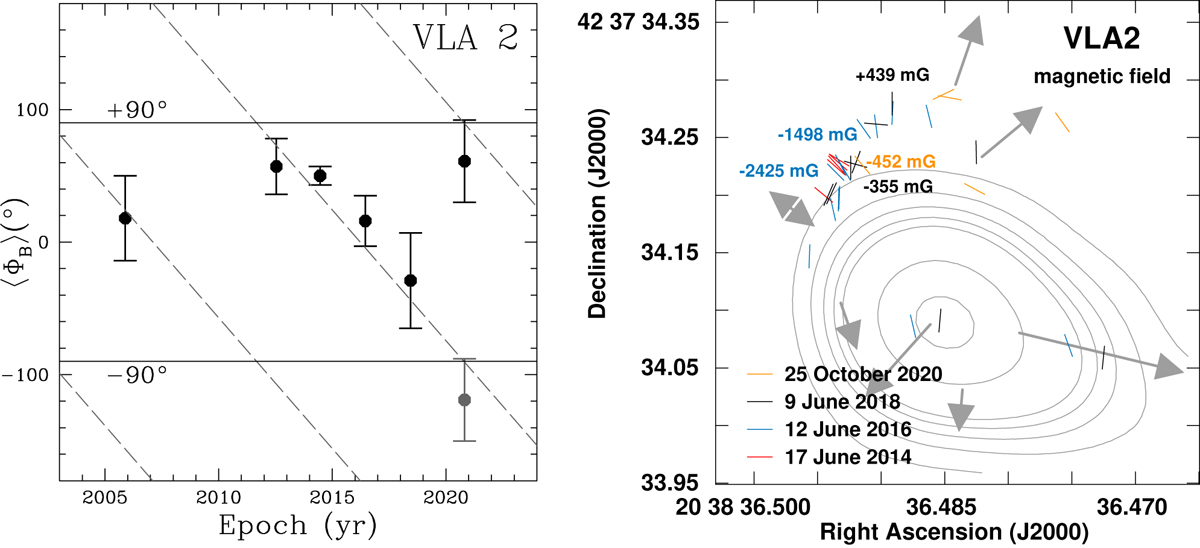
Multi-epoch comparison of ⟨ΦB⟩ angles for VLA 2 in the left panel. The epochs are 2005.89 (VLBA, S11a), 2012.54 (VLBA, S14), 2014.46 (EVN), 2016.45 (EVN), 2018.44 (EVN), and 2020.82 (EVN). The gray point indicate the ⟨ΦB⟩ angle measured in 2020.82 after a rotation of 180°, considering that ⟨ΦB⟩=⟨ΦB⟩±180°. The two horizontal solid black lines indicates the ±90° angles. The dashed gray lines represents the best linear fit results of the data considering that the position angle of a magnetic field vector has contemporary multiple values equal to ⟨ΦB⟩=⟨ΦB⟩±180°. The slopes of these lines are mVLA 2 = ( − 19° .73 ± 1° .89) yr−1. Right panel: magnetic field vectors and strength along the line of sight (next to the corresponding maser feature) as estimated from the linearly and circularly polarized maser features detected around VLA 2 during the four EVN epochs (2014.46, 2016.45, 2018.44, and 2020.82) and superimposed to the natural-weighted continuum maps at K-band (central frequency 22 GHz) of the thermal, collimated ionized wind emitted by VLA 2 (Carrasco-González et al. 2015). For more details see caption of Fig. 4. The arrows represent the direction of the proper motions on the plane of the sky reported in Tables 4–6, and the arrows length is proportional to their magnitudes. The double arrow in the northeast indicates the uncertainties of the motion direction, due to the presence of an inward motion (case A) or of an outward motion (case B) of the gas, as explained in Sect. 3.1.2.
Current usage metrics show cumulative count of Article Views (full-text article views including HTML views, PDF and ePub downloads, according to the available data) and Abstracts Views on Vision4Press platform.
Data correspond to usage on the plateform after 2015. The current usage metrics is available 48-96 hours after online publication and is updated daily on week days.
Initial download of the metrics may take a while.