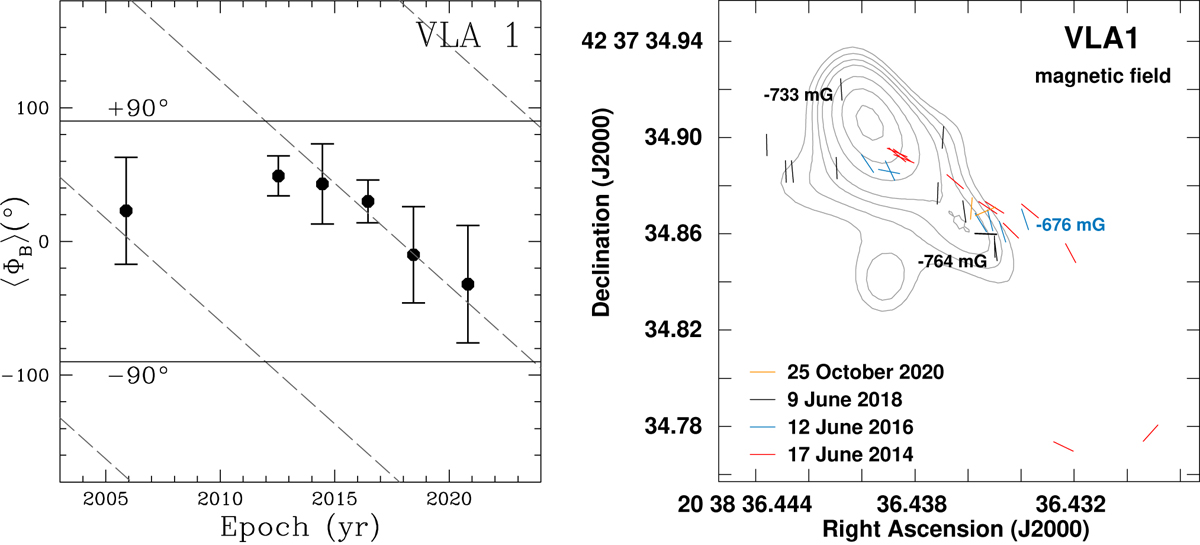
Fig. 11.
Download original image
Multi-epoch comparison of ⟨ΦB⟩ angles for VLA 1 (left panel). The epochs are 2005.89 (VLBA, S11a), 2012.54 (VLBA, S14), 2014.46 (EVN), 2016.45 (EVN), 2018.44 (EVN), and 2020.82 (EVN). The two horizontal solid black lines indicate the ±90° angles. The dashed gray lines represents the best linear fit results of the data considering that the position angle of a magnetic field vector has contemporary multiple values equal to ⟨ΦB⟩=⟨ΦB⟩±180°. The slopes of these lines are mVLA 1 = ( − 15° .38 ± 1° .80) yr−1. Magnetic field vectors and strength along the line of sight (next to the corresponding maser feature) as estimated from all the linearly and circularly polarized maser features detected around VLA 1 (right panel) during the four EVN epochs (2014.46, 2016.45, 2018.44, and 2020.82). The vectors are superimposed to the uniform-weighted continuum map at Q-band (central frequency 44 GHz) of the thermal jet driven by VLA 1 (Rodríguez-Kamenetzky et al. 2020). For more details, see the caption for Fig. 2.
Current usage metrics show cumulative count of Article Views (full-text article views including HTML views, PDF and ePub downloads, according to the available data) and Abstracts Views on Vision4Press platform.
Data correspond to usage on the plateform after 2015. The current usage metrics is available 48-96 hours after online publication and is updated daily on week days.
Initial download of the metrics may take a while.