Fig. 3.
Download original image
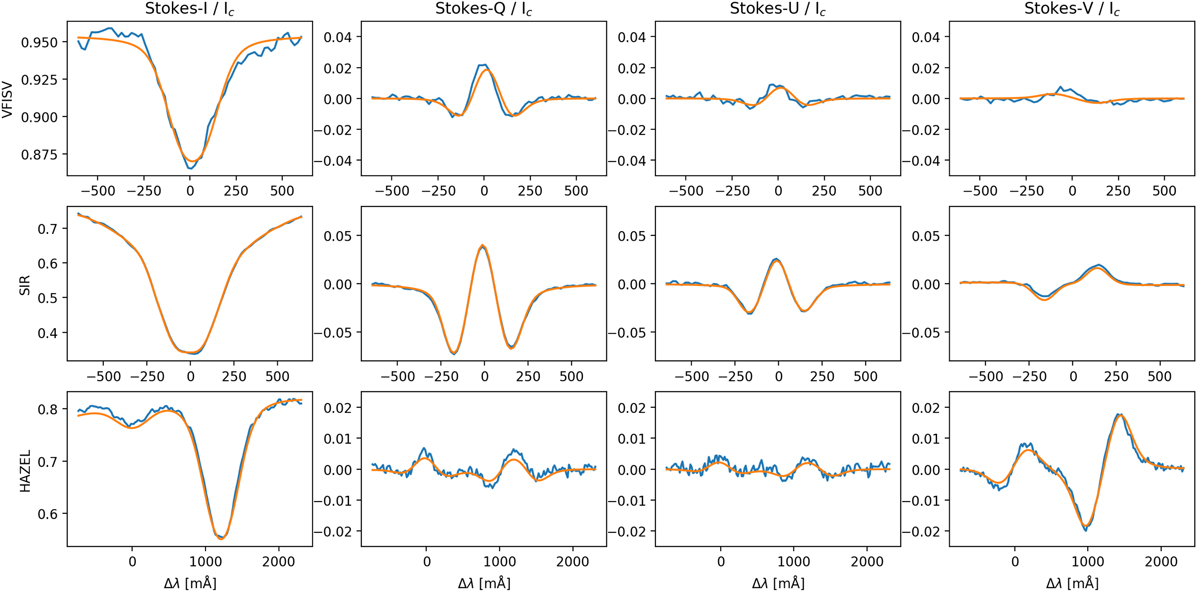
Spectral profiles (observations in blue, inversion fit in orange) of a pixel from the region showing TBFs. The location of this pixel is given in Fig. 1 as a blue cross. Top row: Ca I 10 839 Å line, central row: Si I 10 827 Å line, bottom row: He I 10 830 Å triplet. All spectra are normalized to the quiet-sun continuum value. The spectra for pixels from other regions are shown in Appendix C.
Current usage metrics show cumulative count of Article Views (full-text article views including HTML views, PDF and ePub downloads, according to the available data) and Abstracts Views on Vision4Press platform.
Data correspond to usage on the plateform after 2015. The current usage metrics is available 48-96 hours after online publication and is updated daily on week days.
Initial download of the metrics may take a while.