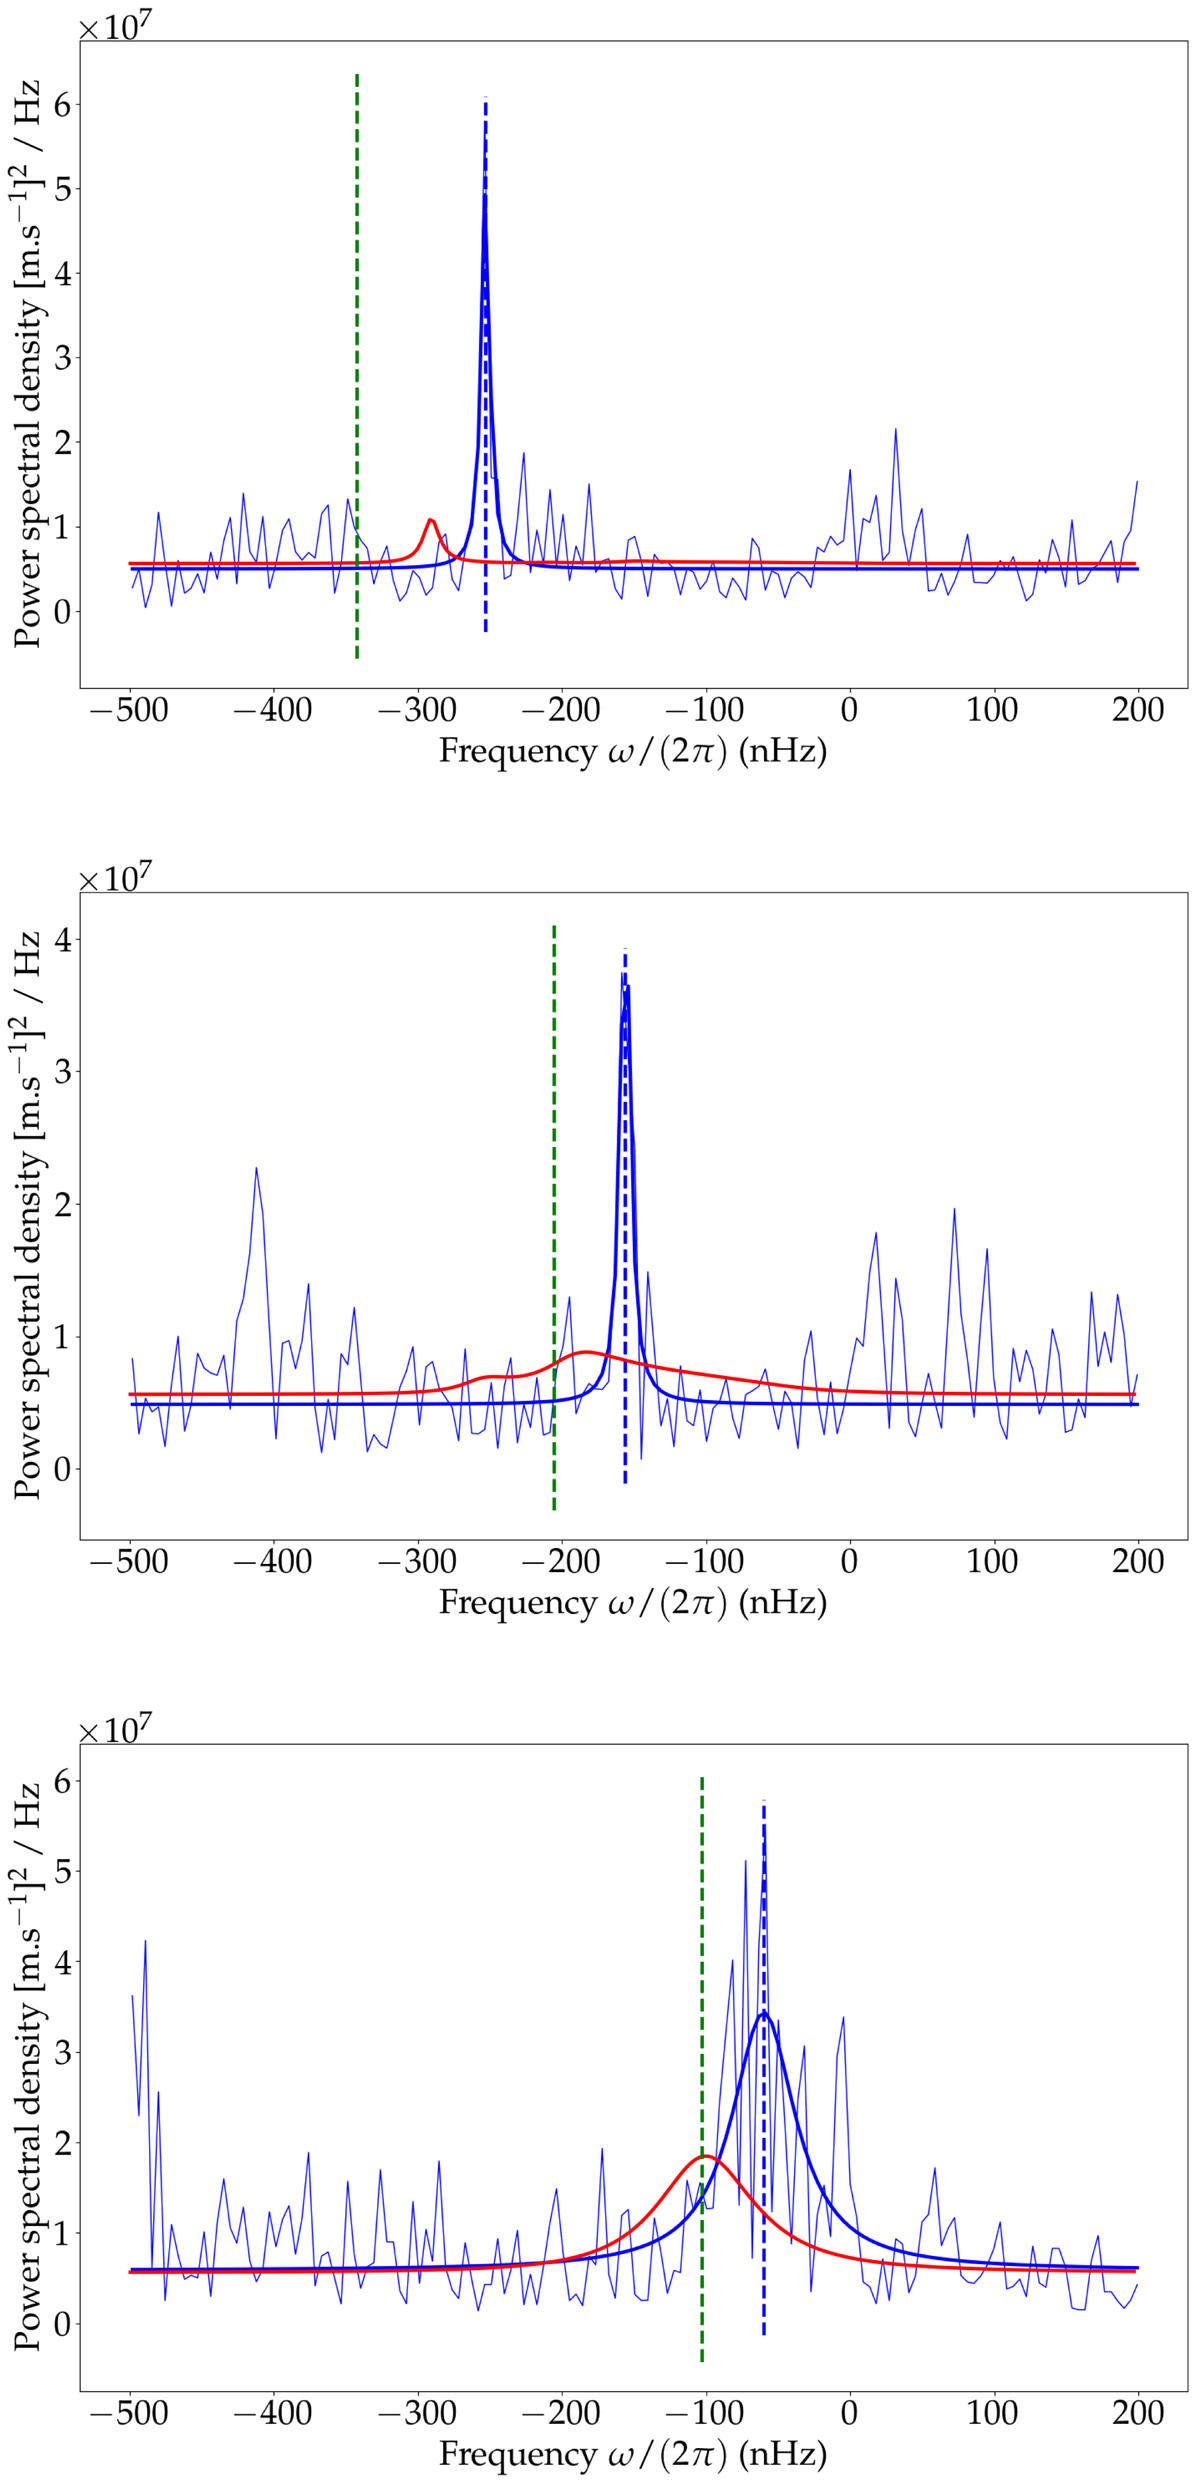
Fig. 9.
Download original image
Latitudinal velocity spectrum, estimated at the solar equator, for azimuthal orders m = 3 (top), 5 (middle), and 10 (bottom), and for a turbulent Reynolds number Returb = 300. The solid red line represents our model, including the contribution both from the inertial modes and from the turbulent noise. The thin blue line shows the solar observations reported by Liang et al. (2019), and the thicker blue line shows the best Lorentzian fit to their data, as reported in their paper.
Current usage metrics show cumulative count of Article Views (full-text article views including HTML views, PDF and ePub downloads, according to the available data) and Abstracts Views on Vision4Press platform.
Data correspond to usage on the plateform after 2015. The current usage metrics is available 48-96 hours after online publication and is updated daily on week days.
Initial download of the metrics may take a while.