Fig. 1.
Download original image
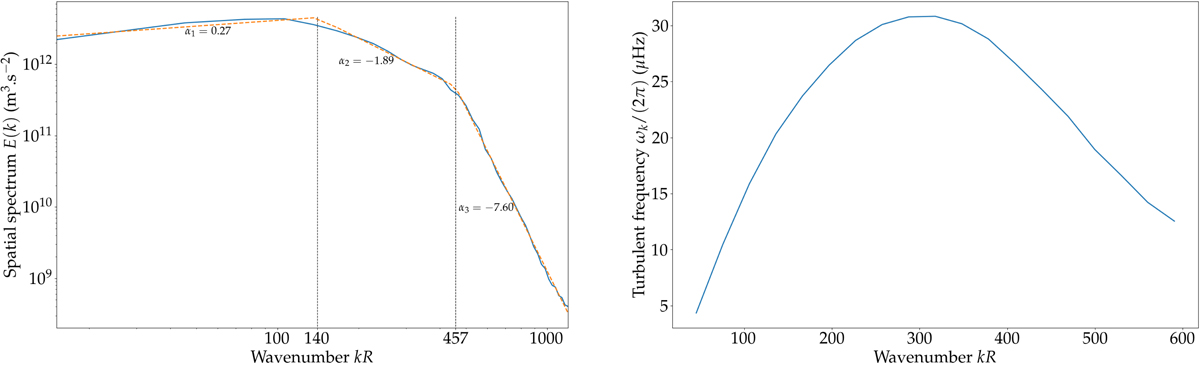
Spatial turbulent spectrum and turbulent frequency. Left: Spatial turbulent spectrum, Eiso(k), extracted from solar observations (solid blue line). The spectrum comprises roughly three sections, each with a different power law in kα. The dashed orange line shows the best fit of the data to a three-piece-wise power law. The exponents and the boundaries between the three regimes are indicated on the plot. Right: Turbulent frequency ωk ≡ kuk as a function of wavenumber, k, where uk is the typical velocity of the turbulent eddies of inverse size k, given by Eq. (47).
Current usage metrics show cumulative count of Article Views (full-text article views including HTML views, PDF and ePub downloads, according to the available data) and Abstracts Views on Vision4Press platform.
Data correspond to usage on the plateform after 2015. The current usage metrics is available 48-96 hours after online publication and is updated daily on week days.
Initial download of the metrics may take a while.