Fig. 6
Download original image
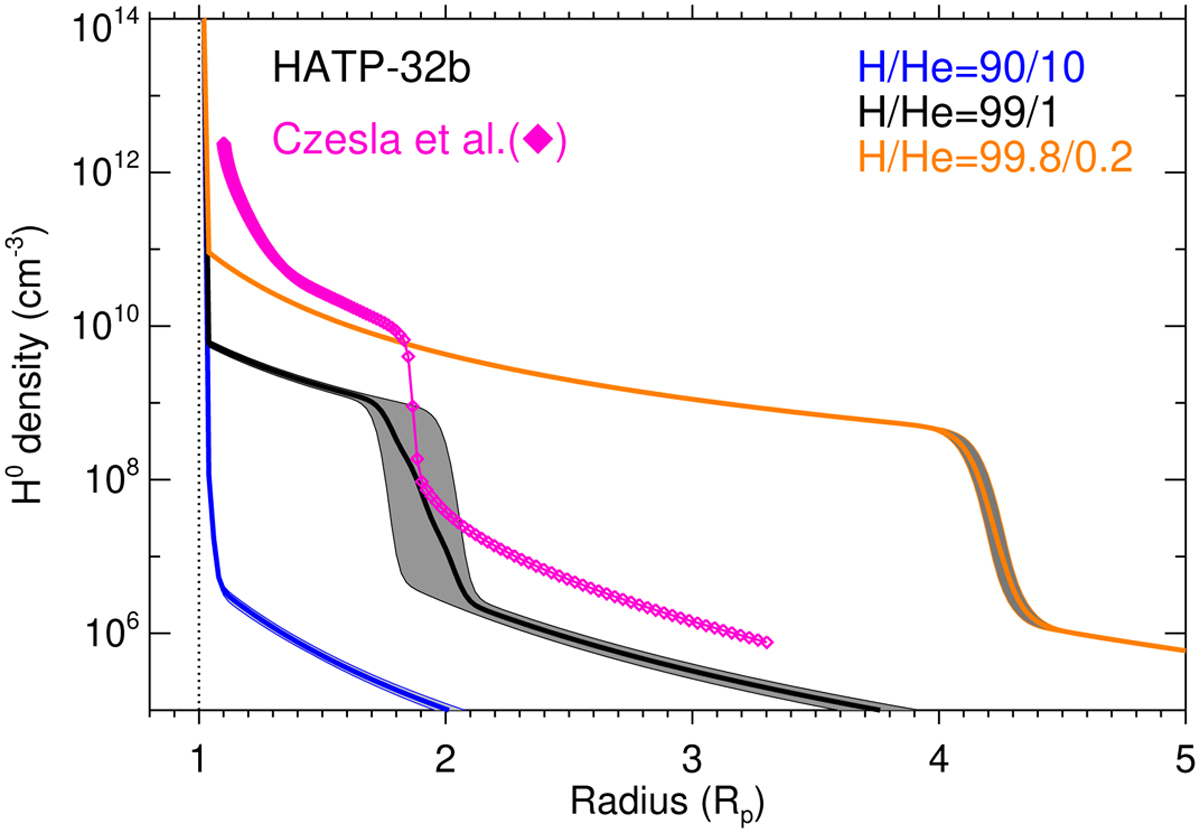
Range of the neutral hydrogen concentration profiles (grey shaded areas) for HAT-P-32 b resulting from the fit of the measured absorption for H/He ratios of 90/10, 99/1, and 99.8/0.2 (for H/He = 90/10 and 99/1 see Fig. 4a). The solid thicker curves are the mean profiles. The H0 density derived from Hα measurements by Czesla et al. (2022) are also shown (magenta diamonds).
Current usage metrics show cumulative count of Article Views (full-text article views including HTML views, PDF and ePub downloads, according to the available data) and Abstracts Views on Vision4Press platform.
Data correspond to usage on the plateform after 2015. The current usage metrics is available 48-96 hours after online publication and is updated daily on week days.
Initial download of the metrics may take a while.