Fig. 4
Download original image
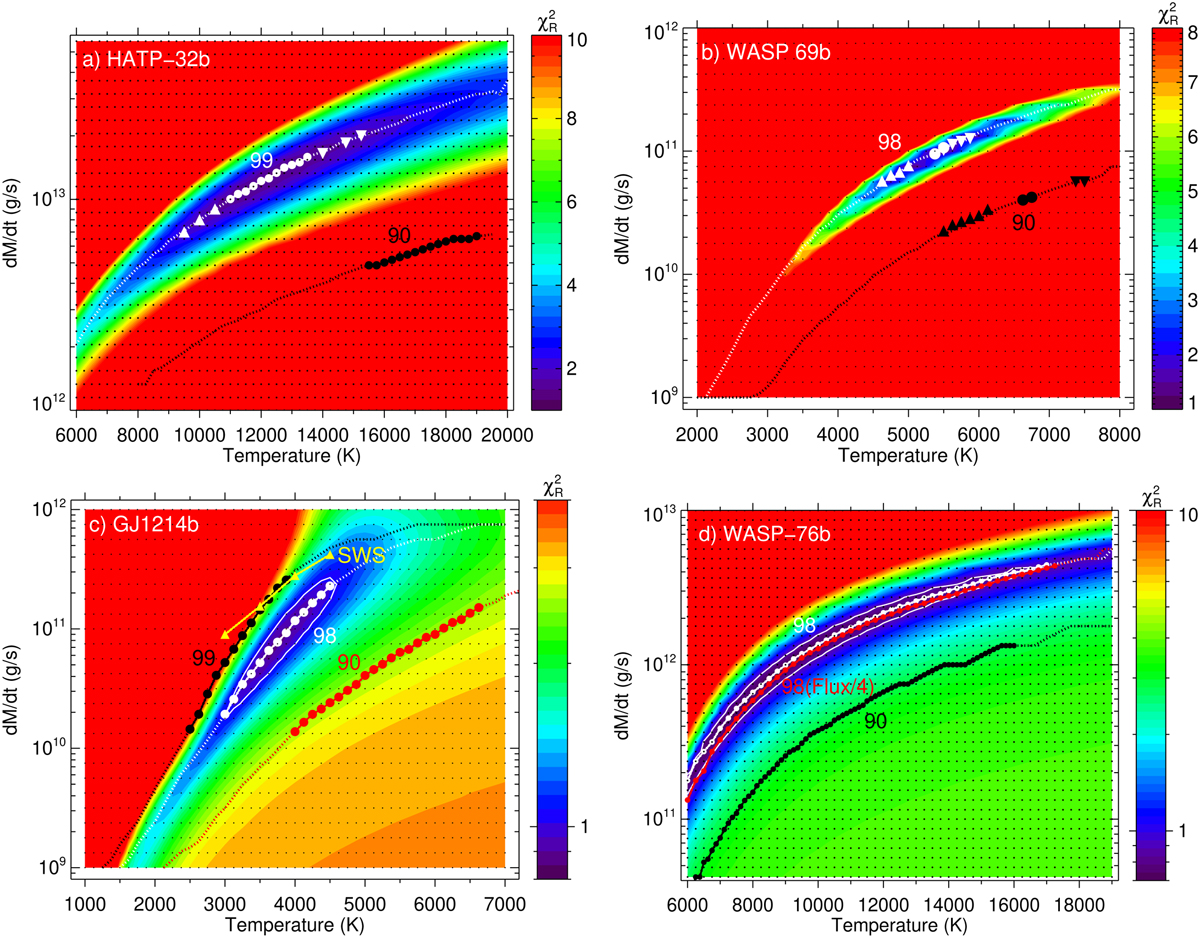
Contour maps of the reduced χ2 of the He(23S) absorption for (a) HAT-P-32 b, (b) WASP-69 b, (c) GJ 1214 b, and (d) WASP-76 b (with different scales of temperature and Ṁ). Dotted curves represent the best fits; the large symbols denote the constrained ranges for a confidence level of 95% (see Sect. 3.5). In panels a and b, the upward triangles represent the limits imposed by including blue and red components (see text). The downward triangles in panel a are the T–Ṁ obtained when assuming null radial velocities of the gas inside the ionisation front (IF) region and in panel b when not including the turbulence broadening. The yellow upward triangles in panel c correspond to the T–Ṁ range obtained when the fast solar wind is considered. The red symbols in panel d correspond to the flux density reduced by a factor of four and those in white for the nominal upper limit. Overplotted are also the curves and symbols for several H/He ratios (e.g. labelled ‘90’ for a H/He of 90/10, ‘98’ for H/He = 98/2). The black dots represent the T–Ṁ grid of the simulations. The minima shown are those obtained from the solutions of the hydrodynamic and non-LTE models for a physically meaningful range of the parameter space.
Current usage metrics show cumulative count of Article Views (full-text article views including HTML views, PDF and ePub downloads, according to the available data) and Abstracts Views on Vision4Press platform.
Data correspond to usage on the plateform after 2015. The current usage metrics is available 48-96 hours after online publication and is updated daily on week days.
Initial download of the metrics may take a while.