Fig. 2
Download original image
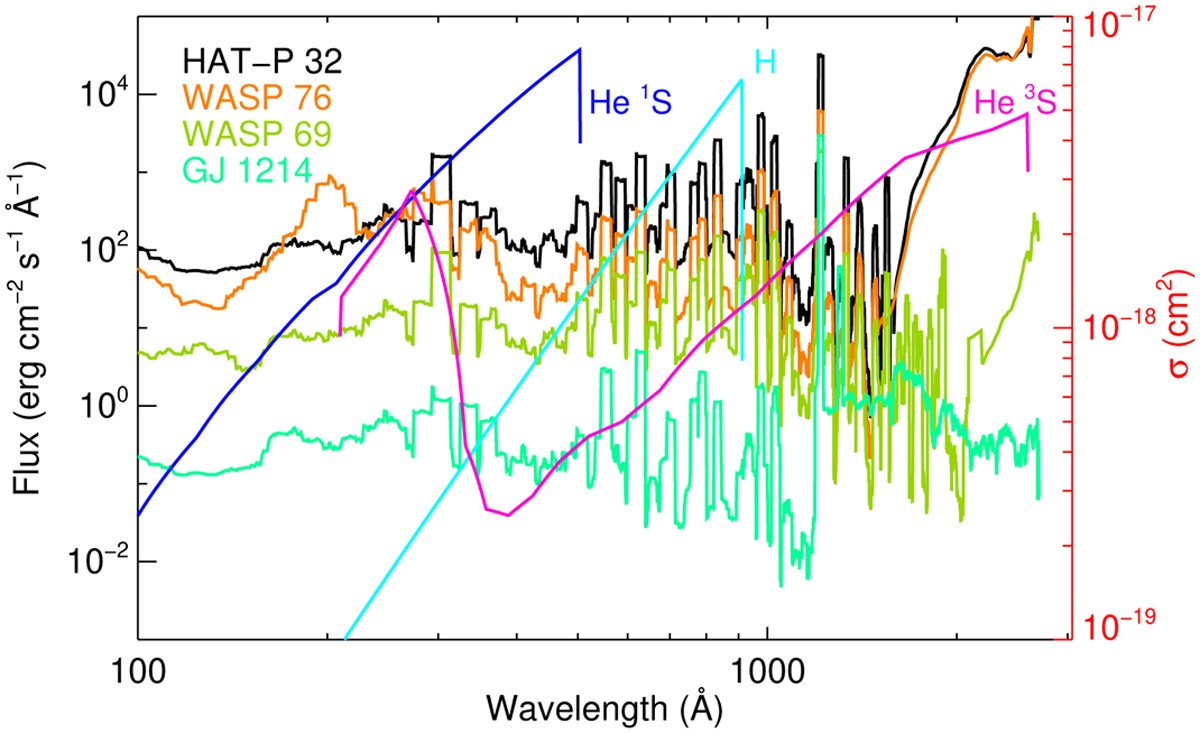
Flux density (left y-axis) for HAT-P-32 (black), WASP-76 (orange), WASP-69 (green), and GJ 1214 (sea green) at the respective planet’s distance plotted at a resolution of 10 Å. In the case of WASP-76, the plotted values are an upper limit. The H, He singlet, and He triplet ionisation cross-sections (σ, right y-axis) are also shown.
Current usage metrics show cumulative count of Article Views (full-text article views including HTML views, PDF and ePub downloads, according to the available data) and Abstracts Views on Vision4Press platform.
Data correspond to usage on the plateform after 2015. The current usage metrics is available 48-96 hours after online publication and is updated daily on week days.
Initial download of the metrics may take a while.