Fig. 11
Download original image
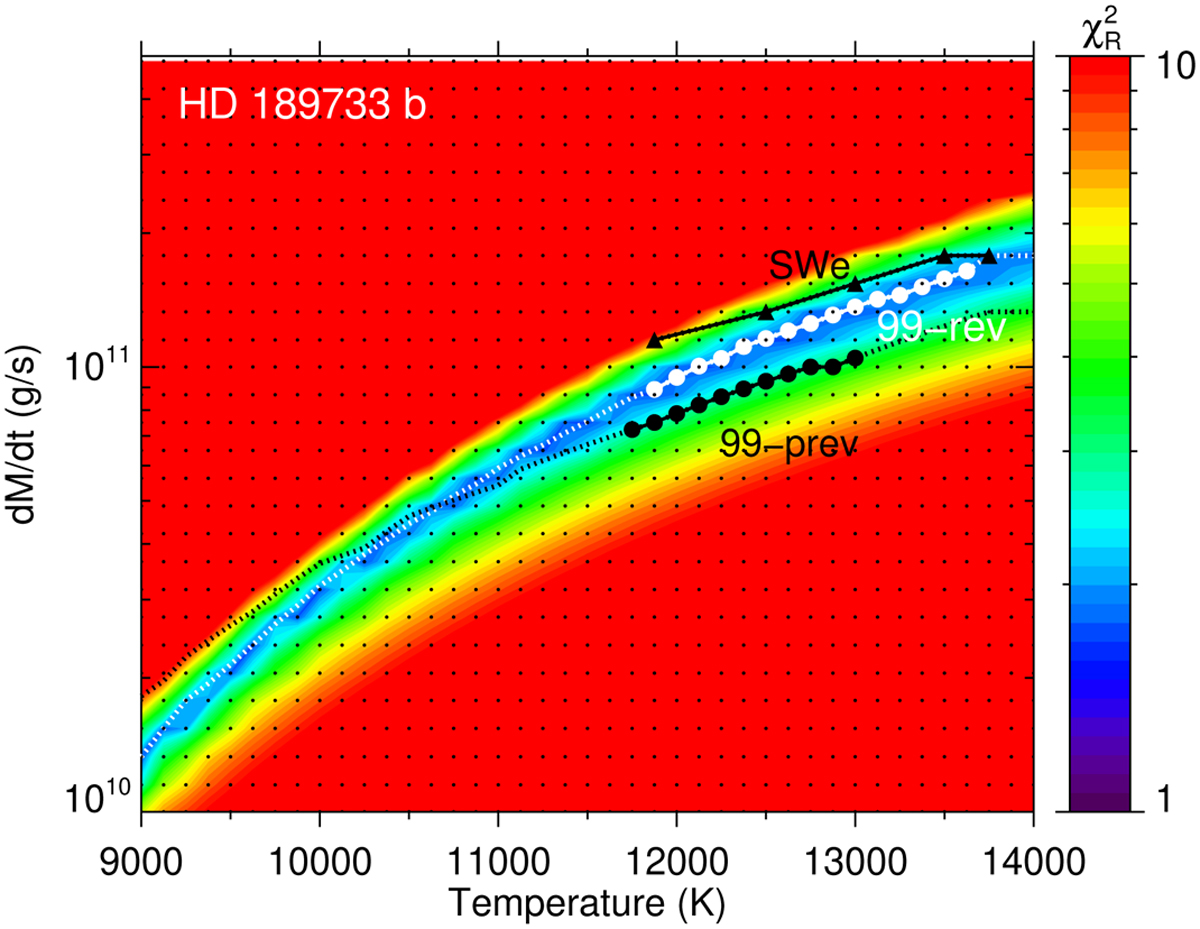
Contour maps of the reduced χ2 for the He(23S) absorption of HD 189733 b. Dotted curves represent the best fits with large symbols denoting the constrained ranges for a confidence level of 95%. Overplotted are also the estimations when including the effects of the stellar winds with a scaled solar wind (see Sect. 3.2, black triangles), and the curve and circles (in black) obtained previously by Lampón et al. (2021b).
Current usage metrics show cumulative count of Article Views (full-text article views including HTML views, PDF and ePub downloads, according to the available data) and Abstracts Views on Vision4Press platform.
Data correspond to usage on the plateform after 2015. The current usage metrics is available 48-96 hours after online publication and is updated daily on week days.
Initial download of the metrics may take a while.